Post Incident Analysis Report
Overview
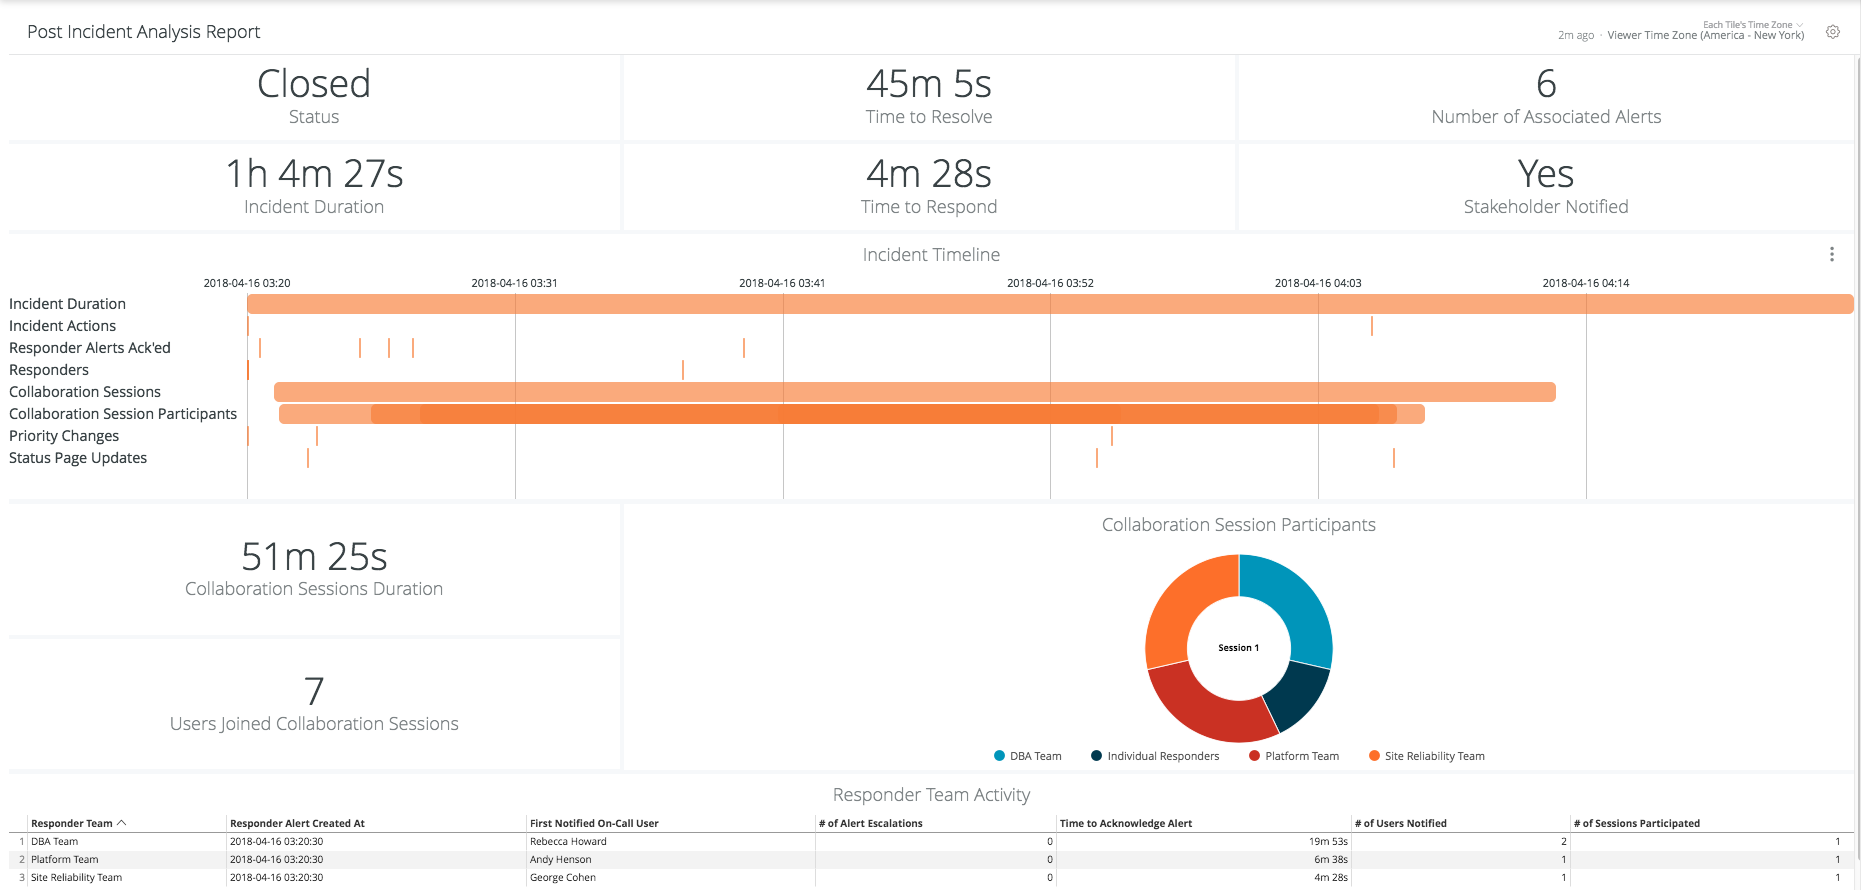
Our Post Incident Analysis Report powered by Looker leverages valuable data from past incidents to arm teams with insight to improve their incident response. The report is automatically generated after an incident is resolved or closed and consists of analytics such as duration, time to resolve, and time to respond, as well as analytics on different aspects of collaboration efforts. This report builds off Opsgenie’s existing Reporting and Analytics to heighten a user’s understanding of their incident management workflow and areas for improvement.
The Post Incident Analysis Report is available as part of our Service-Aware Incident Management platform which is only available to our Enterprise plan.

The report includes overview metrics for the lifecycle of the incident. You can reach the Post Incident Analysis of each incident from the Details view of an incident, if the incident is Resolved or Closed. This report is comprised of “Looks”; self-contained modules comprised of different data on different aspects of the incident.

Looks:
Status:
The current status of the incident (Resolved or Closed).
Incident Duration:
The time elapsed between the incident creation and its closure.
Time to Resolve:
The time elapsed until the incident is Resolved. If the incident is reopened after it is resolved, then the latest Resolve time is taken as ‘Time to Resolve’.
Time to Respond:
The time elapsed until the acknowledgment of a Responder Alert. If there are multiple Responder Teams, the earliest acknowledgment time between all Responder Alerts is used.
Number of Associated Alerts:
Number of alerts that are associated with this incident.
Drill into this Look to see the Associated Alerts and the following properties: Message, Teams, Priority, Tags, Time to Acknowledge, Time to Close, Status, Owner, Source, Deduplication Count, and ID.
Stakeholders Notified:
Shows if the Stakeholders are notified or not in Yes/No format.
Incident Timeline:
Shows all the actions and steps taken during the incident. The durations are shown as long bars whereas the momentary actions are shown as lines.
Hover over the bars with your mouse to see details of an event and specific times for occurrence and duration.
Collaboration Sessions Duration:
The total duration of the Incident Command Center sessions launched for the incident.
Drill into this Look to see the Conference ID, Room name, Start Time, End Time, and Duration (For a more in-depth look into a Conference Session, remember to look at the Past Sessions tab of the Incident Command Center for a specified session).
Users Joined Collaboration Sessions:
Total number of users that joined the Incident Command Center sessions launched for the incident.
Drill into this Look to see the specific users that joined.
Collaboration Session Participants:
Shows the participation of each team per session in donut multiples. The users that joined the sessions from each team can be seen by the drilling to each team’s participation.
Hover over the donut chart to see the number of users that joined from each team for each session.
Click the teams at the bottom of this Look to remove/add their data from/to the donut.
Responder Team Activity:
Shows the metrics for each Responder Team’s activity during the incident in a table chart.
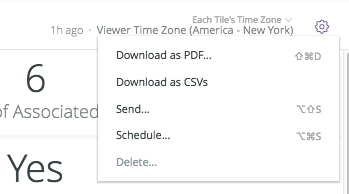
You can download the Post Incident Analysis and the underlying data in a variety of formats to share with team members. You can even schedule periodic delivery of the report directly from within OpsGenie interface. Do this by accessing the gear icon on the top right of the report's dashboard and selecting the desired function.

Updated 11 months ago
Check out our Incident Command Center documentation for a look into the Past Session reporting feature, as it compliments the Post Incident Analysis Report
