Track Your Events
Tracking events within your Opsgenie organization is important for most cases. You might want to see the notification analysis or MTTA/MTTR reports within your organization, you might need to check the life-cycle of an alert for a received integration data, or you might want to track configuration updates within your organization. Whatever your reason maybe, Opsgenie provides several services and ways to help you track the events within Opsgenie.
Alert Activity Logs
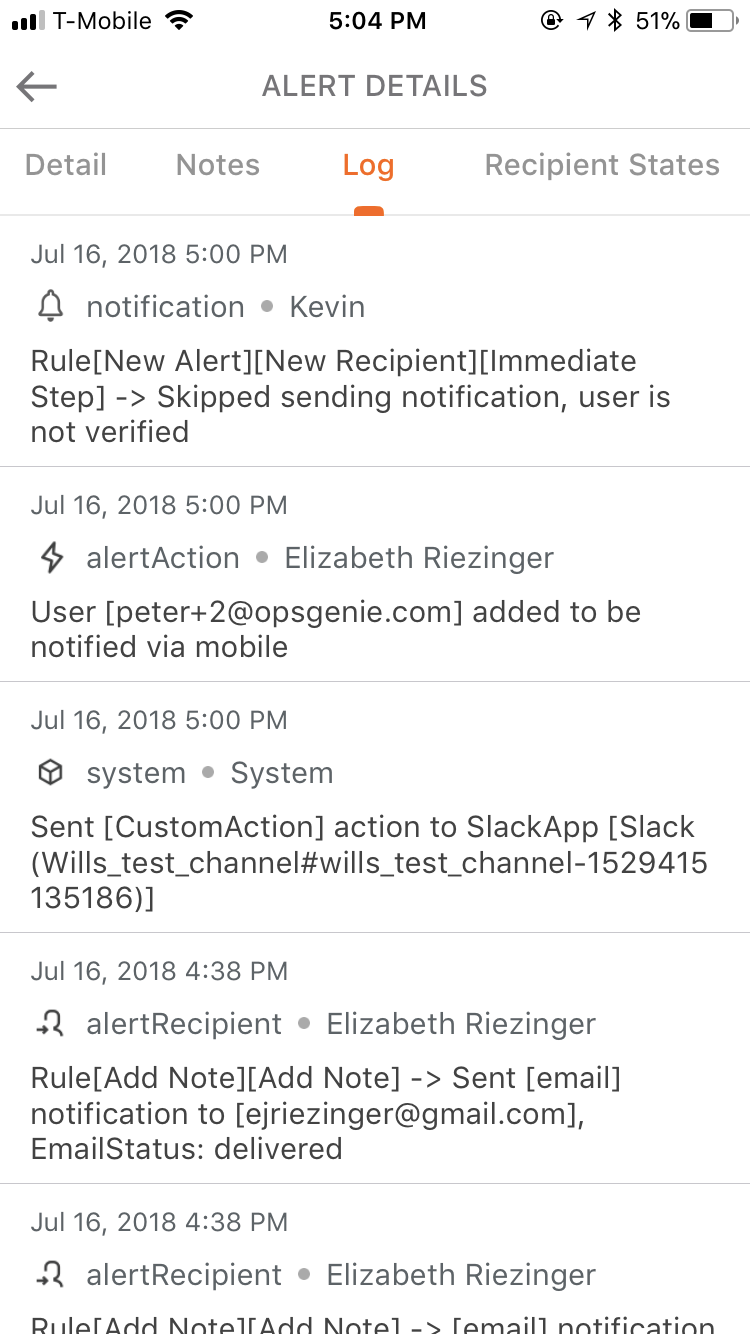
The first place to track the life/notification cycle of your alerts is the Activity Log tab, that can be found on the "Alert Details" window, when you click an alert. Alert activity logs can also be displayed through our mobile apps within Alert Details -> Logs tab.


Alert logs help with tracking:
- Alert creation and action sources (integration, user, chat command, etc.).
- Users that are added recipients, when they are added and which configuration adds them.
- Notification states related with the alerts.
- Activities that affects alert state (including alert actions like acknowledge, close, etc).
- Triggered policies for the alert.
- Possible errors that were encountered within the alert life cycle.
- De-Duplication events.
Alert activity logs contain nearly all of the necessary information for troubleshooting related with alerts.
Logs Page
If you're not an owner or admin within your Opsgenie organization, you cannot display your account Logs Page.

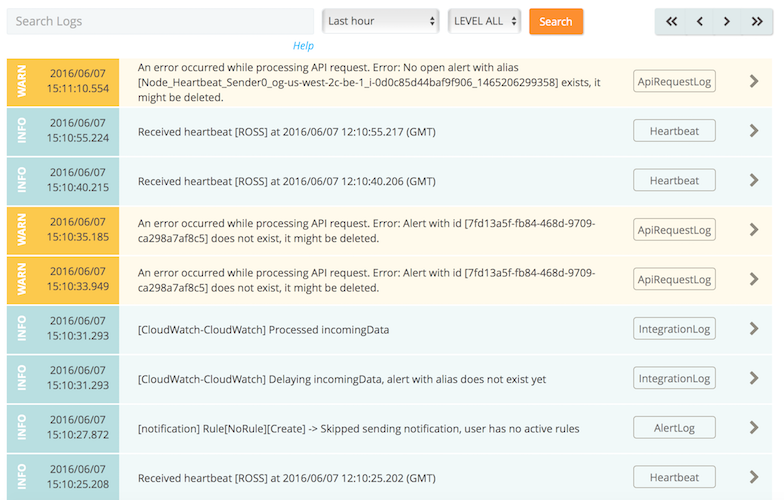
Logs Page is the place where all the incoming data related to integrations, configuration updates within your organization, and detailed versions of the alert activity events that can be viewed in the alert activity logs. You can search for specific integrations, alerts, notification rules, etc. in the search tab; and specify the time interval to search for. Please note: you can search your organizational logs through the Logs Page for the last 2 weeks from that moment. You can refer here for further information and advanced query guidance about the Logs page.
The Logs page is the best place to go to if you’re having trouble with your integrations. Troubleshooting integration data flow, in general, follow the same pattern:
- First, you can check the logs of the originating system to verify that a request is made.
- Then, check the Logs page of Opsgenie to verify that the request is received.
- If the request is received, then you can look into how it was processed.
- If the request is not received, then you can check the sending side configuration.
Reports
Customers under the Standard plan can access our new Monthly Overview Report powered by Looker. New Reporting dashboards powered by Looker are available to customers under the Enterprise plan. Contact Support with any questions.
If you're not an owner or admin within your Opsgenie organization, you cannot display the Reports Page.
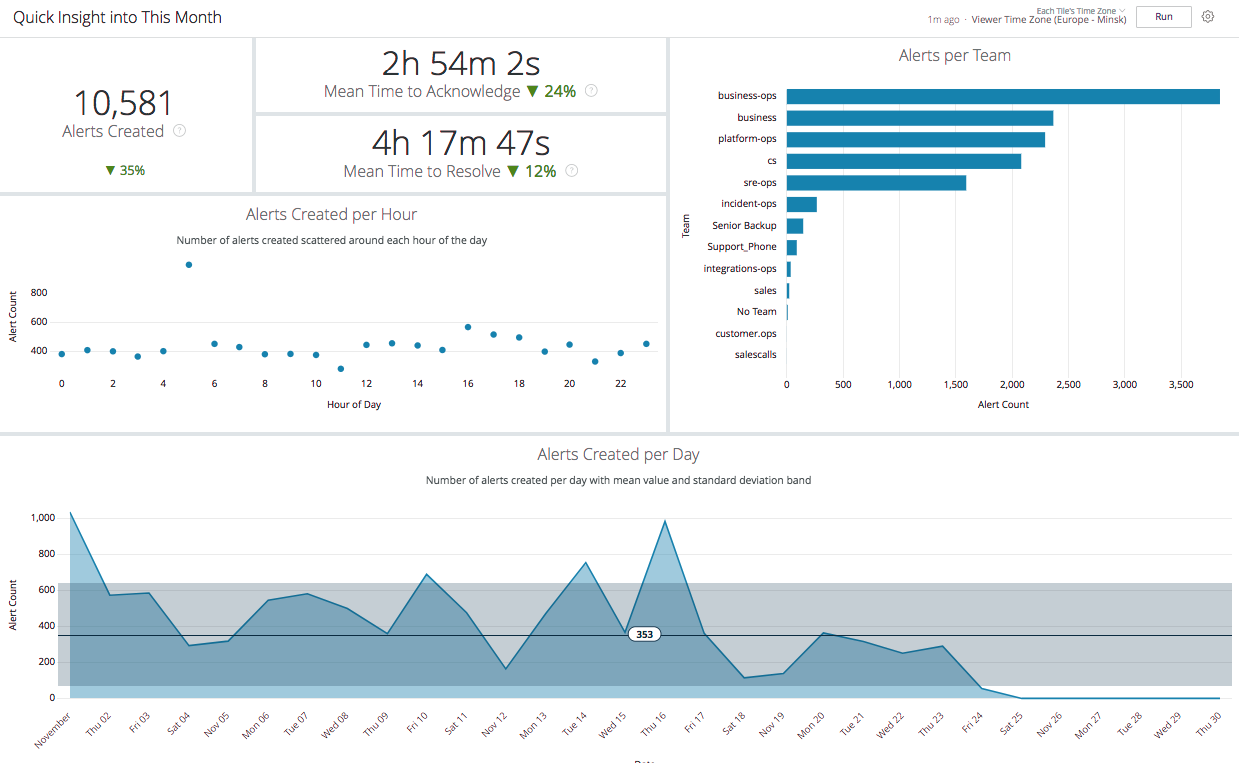
The Reports page is the place for analyzing your alerts, notifications, mean time to act on them, and provides a better understanding of your teams workload and how it changes in time. You can navigate to specific dates to see trends in weekly and monthly views. The Reports page includes all of the following and can also be retrieved for specific time intervals:
- Number of alerts.
- Mean time to acknowledge/close.
- Alerts per Team.
- Alerts Created per Hour.
- Alerts Created per Day.
*API Usage Reports - Exporting Alerts.
For further information on the Reports Page, you can refer here.
Reporting Dashboards

Updated 10 months ago
