Terminology and Advanced Capabilities
Terminology
-
Spaces: Spaces contain a set of dashboards that make sense together.
-
Dashboards: Dashboards are the reports you can find under the spaces which include multiple tables or graphs (looks) on one page, so that you can see all the related analysis regarding a specific function in a single place.
-
Looks: Looks are the individual tables and graphs that you can find in a dashboard.
-
Drills: Drills are the additional dimensions in your looks which allow you to see additional data for the data set you are selecting on a specific look. You can reach the drills by clicking on the graphs.
-
Filters: Conditions at the top of each dashboard which you alter and combine to specify what data you are looking for. These filters are different depending on the dashboard you are currently accessing but allow for a highly customized report.
Advanced Capabilities
Filtering the reports according to a specific field:
- Open the dashboard from the Reporting sidebar that you want to view.
- Navigate to the Filter bar that is at the top of the dashboard and click on the bar to expand it.
- Enter the filter values that you would like to apply to the dashboard and click the Run button that is in the top-right corner.
- Collapse the Filter bar and the filtered view of the dashboard becomes visible.
Filtering by Tags and TeamsWhen filtering by tags and/or teams, please use the 'contains' operator and enter the full tag/team name. These two attributes are list attributes and the 'contains' operator would search for the specific tag/team typed within the list.
Downloading the dashboards/looks:
- Open the dashboard from the Reporting sidebar that you want to download.
- Access the top right of your dashboard where the Run function and settings icon are.
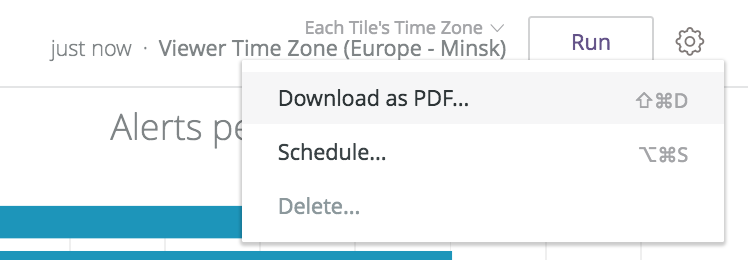
- Click the settings icon.
- Click Download as PDF…. A download dialogue box appears.
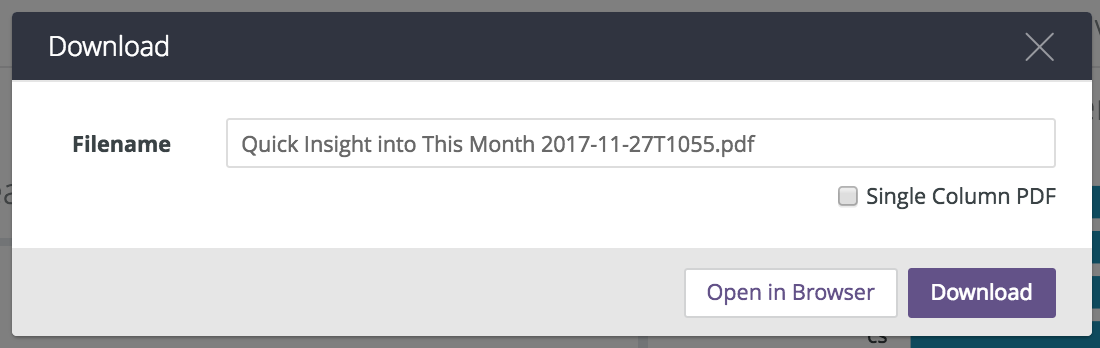
- Type and designate a file name for the downloaded report. You have the option to Open in Browser which will redirect you to a page generated by Looker with your report.
- Click Download. Now you have a downloaded report of the dashboard you chose.
Scheduling emails for receiving dashboards/looks:
- Open the dashboard from the Reporting sidebar that you want to download.
- Access the top right of your dashboard where the Run function and settings icon are.
- Click the settings icon.
- Click Schedule…. A scheduling dialogue box appears. If you haven’t already designated a schedule before, it opens with a new schedule for you to fill out. If you have previously made a schedule, you can select Create New Schedule to create an entirely different one.
- Designate the time intervals which the report is sent and the recipients’ email addresses. There are options to apply filters to a scheduled report, repeat the sending, add a message, and change the format of the report.
- Click Save All when all selections have been made.

Hiding/showing a value in specific looks:
- In specific looks where the value labels are available, you can hide/show the values by clicking on the labels. Once a value is hidden, the look would be adjusted automatically with the remaining values.

Updated 10 months ago