Splunk Integration
Splunk makes it simple to collect, analyze and act upon the untapped value of the big data generated by your technology infrastructure, security systems, and business applications. Splunk has an alerting functionality.

Splunk alerts can be used to monitor for and respond to specific events. Alerts use a saved search to look for events in real time or on a schedule. Alerts trigger when search results meet specific conditions. Alert actions can be used to respond when alerts trigger.
What does Opsgenie offers Splunk users?
Splunk's Searching and Reporting app lets users search their data, create data models and pivots, save searches and pivots as reports, configure alerts, and create dashboards. Through Opsgenie's Alerts app, forward Splunk alerts to Opsgenie. With the Splunk Integration, Opsgenie acts as a dispatcher for these alerts, determines the right people to notify based on on-call schedules– notifies via email, text messages (SMS), phone calls, iOS & Android push notifications, and escalates alerts until the alert is acknowledged or closed.
Functionality of the integration
- Opsgenie has a Splunk-specific alert app to send Splunk alerts to Opsgenie. Opsgenie also has a specific API for Splunk Integration, Splunk sends alerts through Opsgenie Alerts app to Opsgenie and Opsgenie handles the automatic creation of alerts.
Add Splunk Integration in Opsgenie
- Please create an Opsgenie account if you haven't done so already.
- Go to Opsgenie's Splunk Integration page.
For Free and Essentials plans, you can only add the integrations from the Team Dashboards, please use the alternative instructions given below to add this integration.
- Specify who is notified for Splunk alerts using the Teams field. Auto-complete suggestions are provided as you type.
An alternative for Step 2) and Step 3) is to add the integration from the Team Dashboard of the team which will own the integration. To add an integration directly to a team, navigate to the Team Dashboard and open Integrations tab. Click Add Integration and select the integration that you would like to add.
- Copy the API Key.
- Click Save Integration.
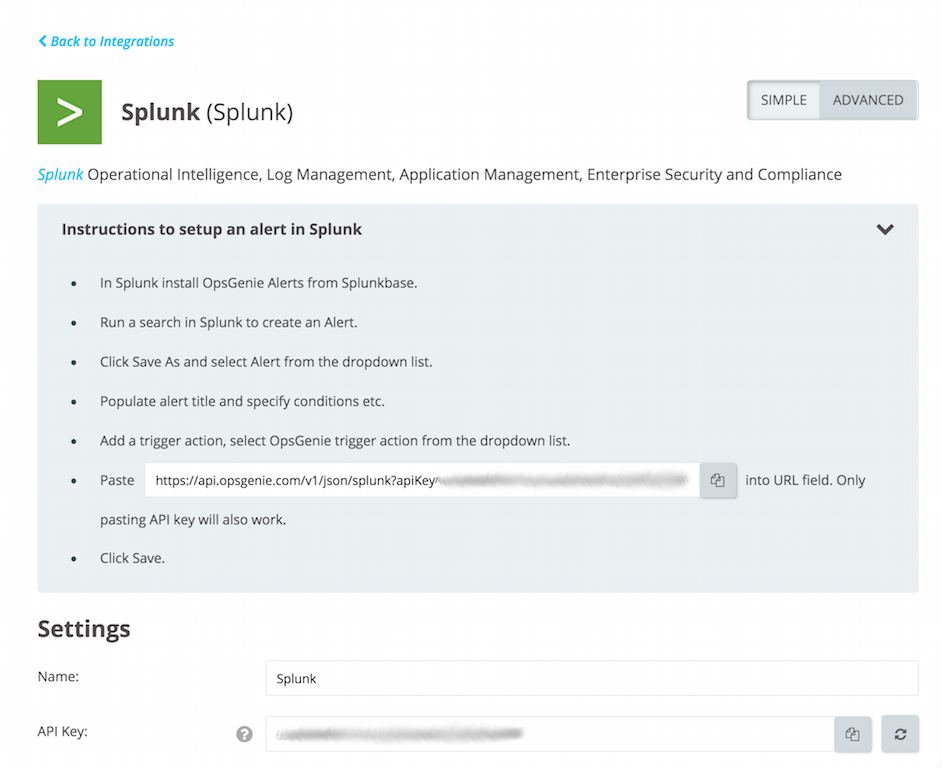
Configuration in Splunk
- In Splunk, install the Opsgenie App from Splunkbase.

- After installation, navigate to "Apps" and click Set Up to configure the Opsgenie App.

- Paste the API Key copied previously in the chapter:Add Splunk Integration in Opsgenie

Updating API KeyIf using Splunk Cloud and need to update the API Key you've set in this step, please file a Splunk support case to uninstall the app.
- Run a search in Splunk to create an Alert.
- Click Save As and select "Alert" from the dropdown list.
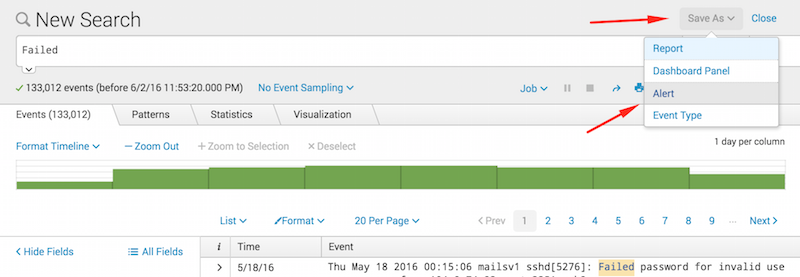
- Populate alert title and specify conditions.
- Click the +Add Actions button to access the dropdown list and select "Opsgenie".
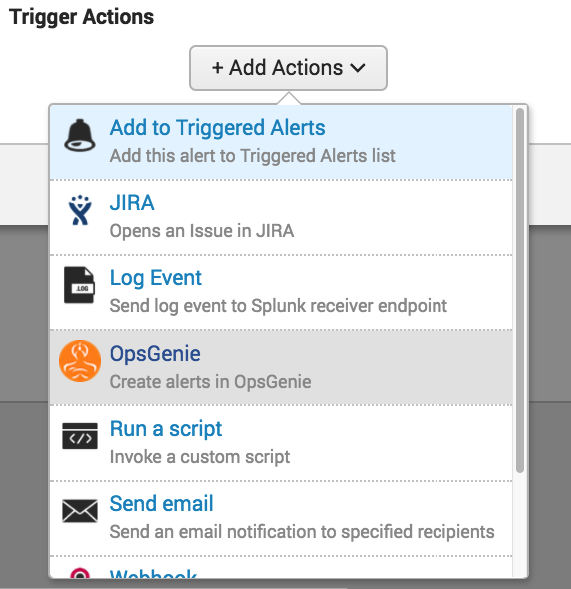
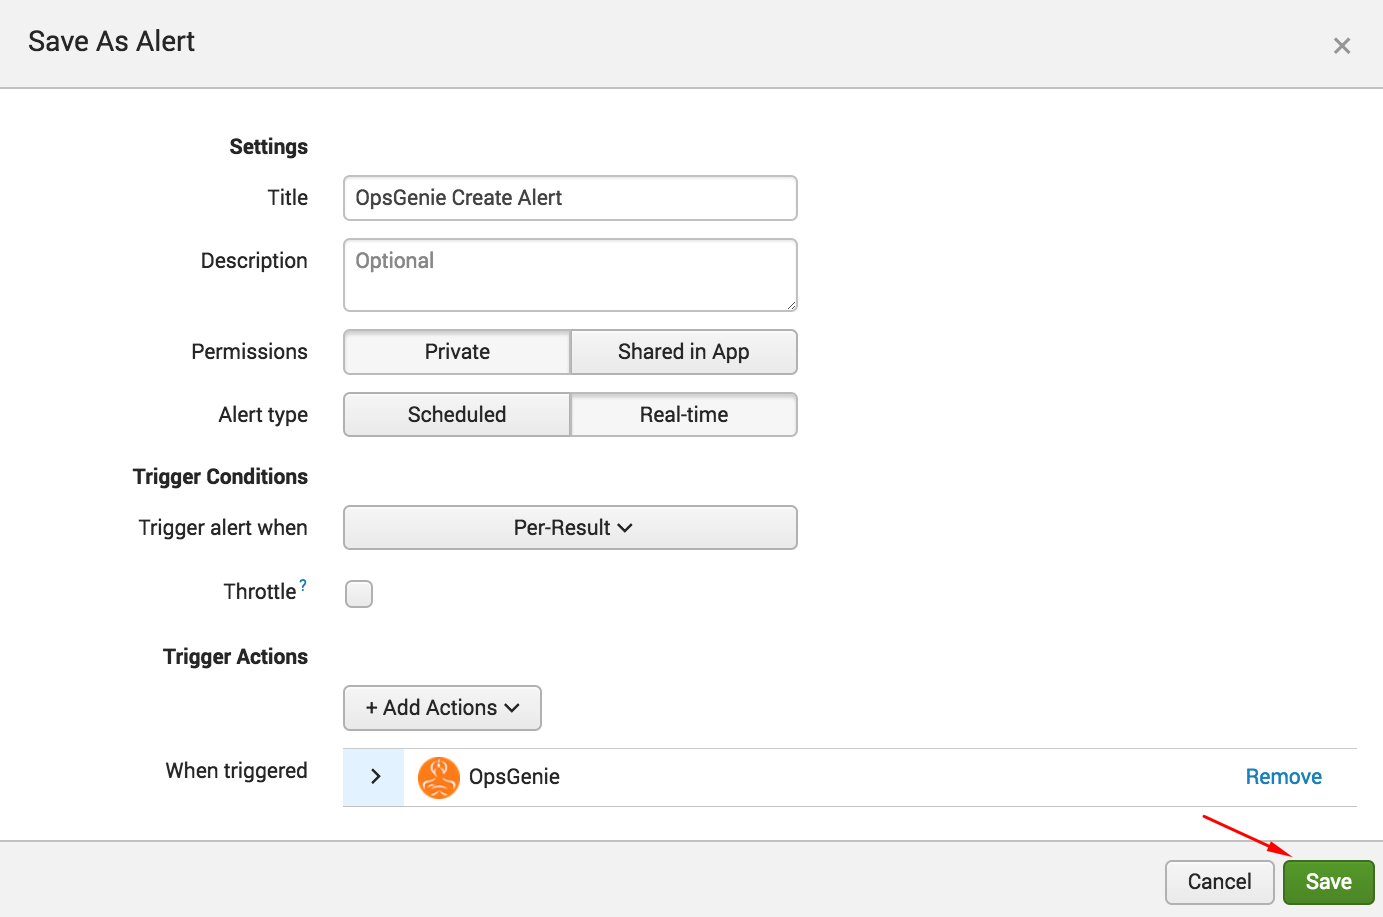
- Click Save.
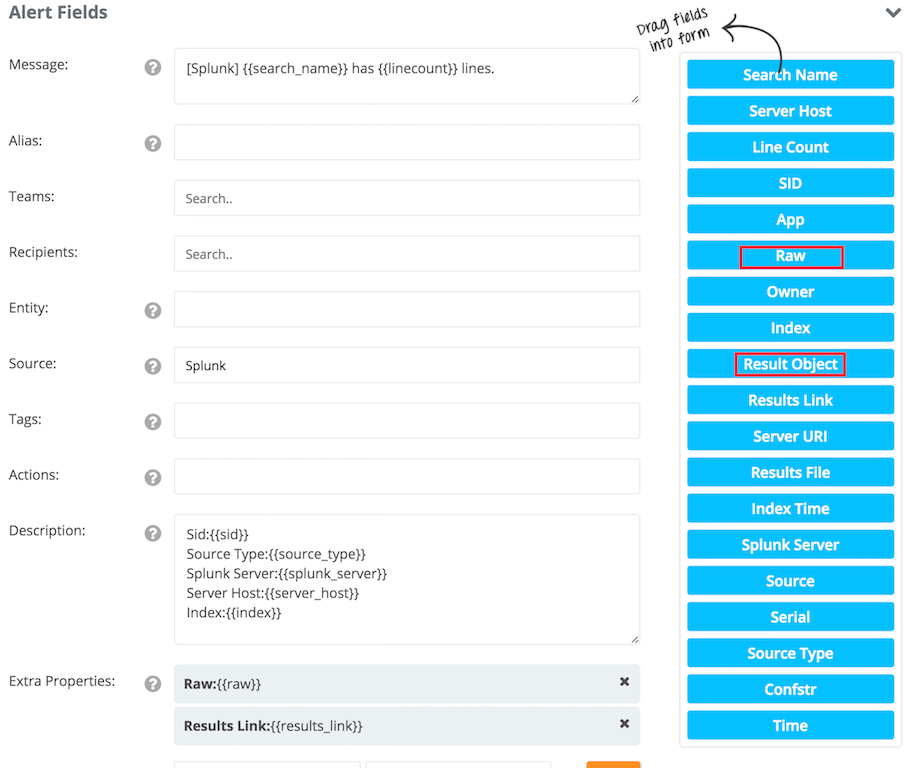
Sample payload sent from Splunk and draggable fields in Opsgenie
The result field of the content below differs according to the fields of the lines that match the search. That's why Opsgenie provides common fields of the result object in available fields. Raw, Index, Serial, Source Type etc. are examples of the common fields.
We also added "Result Object" to the available fields, to make it possible to extract custom fields from the result object.
For example, to put the date_month field of result object to the alert: {{result.date_month}} solves the problem.
Create Alert payload:
{
    "session_key": "r41vK7psTN9iIp1HQXqgNxTHPz2AW_Ee3ELbdYM4FBqiBbI7L6f82o6f6IENt6Q_Xdq2V4jBSkjkyIfXIm56xbbcFcpWlcJNB0ZUZaezsImsTQ2lGWH26yiZ8l854Or8SPETrWuVgTKVeC",
    "search_name": "fail",
    "results_link": "http://Tuba-MacBook-Pro.local:8000/app/search/search?q=%7Cloadjob%20rt_scheduler__admin__search__fail_at_1464802733_32.0%20%7C%20head%201%20%7C%20tail%201&earliest=0&latest=now",
    "app": "search",
    "sid": "rt_scheduler__admin__search__fail_at_1464802733_32.0",
    "configuration": {
        "api_url": "http://4kmm916oxm9m.runscope.net"
    },
    "server_host": "Tuba-MacBook-Pro.local",
    "owner": "admin",
    "results_file": "/Applications/Splunk/var/run/splunk/dispatch/rt_scheduler__admin__search__fail_at_1464802733_32.0/per_result_alert/tmp_0.csv.gz",
    "server_uri": "https://127.0.0.1:8089",
    "result": {
        "date_month": "may",
        "index": "main",
        "_indextime": "1464802756",
        "date_minute": "15",
        "date_hour": "0",
        "splunk_server": "Tuba-MacBook-Pro.local",
        "date_mday": "11",
        "sourcetype": "secure",
        "source": "tutorialdata copy 2.zip:./www1/secure.log",
        "date_second": "2",
        "_serial": "0",
        "_sourcetype": "secure",
        "date_year": "2016",
        "eventtype": "",
        "_kv": "1",
        "timeendpos": "25",
        "timestartpos": "4",
        "linecount": "1",
        "date_zone": "local",
        "date_wday": "wednesday",
        "punct": "____::__[]:________...___",
        "_raw": "Thu May 11 2016 00:15:02 www1 sshd[4747]: Failed password for invalid user jabber from 118.142.68.222 port 3187 ssh2",
        "_eventtype_color": "",
        "_confstr": "source::tutorialdata copy 2.zip:./www1/secure.log|host::Tuba-MacBook-Pro.local|secure",
        "_time": "1462914902",
        "host": "Tuba-MacBook-Pro.local"
    }
}
Sample Alert

Contact
- Live chat on www.opsgenie.com
- Sales: 24x7 @ 571-550-9494
- Support: 24x7 @ 571-748-7000
- [email protected]
Updated 9 months ago
