SignalFx Integration
SignalFx is a cloud-based monitoring solution offers flexibility to any size operation. It aggregates and analyzes the metrics needed to detect outliers, manage capacity, and spot service-level trends before they affect performance.

What does Opsgenie offer SignalFx users?
SignalFx detectors monitor signals and send alerts when they cross defined thresholds. With the SignalFx Integration, Opsgenie acts as a dispatcher for these alerts, determines the right people to notify based on on-call schedules– notifies them using email, text messages (SMS), phone calls, and iPhone & Android push notifications, and escalates alerts until the alert is acknowledged or closed.
Opsgenie has a specific API for SignalFx Integration, SignalFx sends alerts to Opsgenie and Opsgenie handles the automatic creation of alerts.
Functionality of the integration
- SignalFx detectors monitor signals and send alerts when they cross defined thresholds. When an alert is created in SignalFx, an alert is also created in Opsgenie automatically through the integration.
- When values is back to normal, SignalFx detectors resolves the alert. When an alert is resolved in SignalFx, an alert is also closed in Opsgenie.
Add SignalFx Integration in Opsgenie
- Please create an Opsgenie account if you haven't done so already.
- Go to Opsgenie's SignalFx Integration page.
For Free and Essentials plans, you can only add the integrations from the Team Dashboards, please use the alternative instructions given below to add this integration.
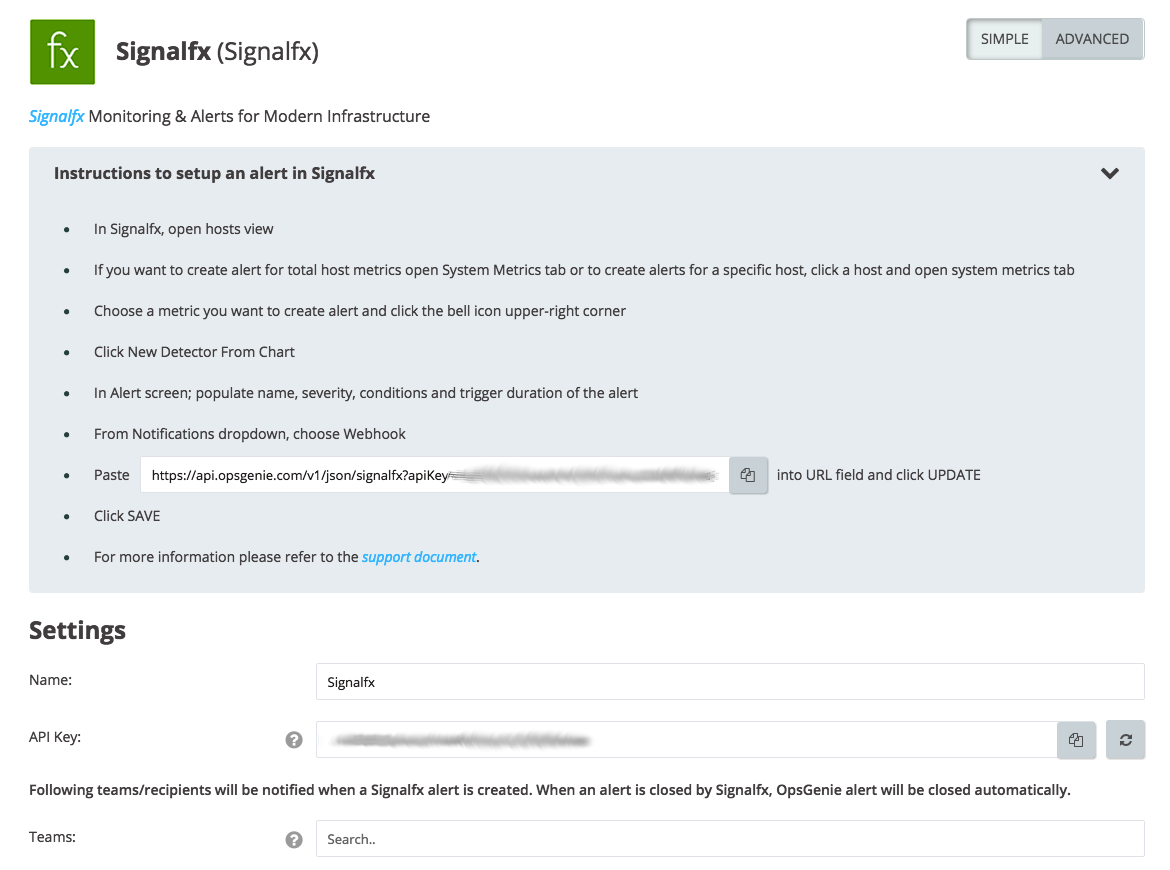
- Specify who is notified of SignalFx alerts using the Teams field. Auto-complete suggestions are provided as you type.
An alternative for Step 2) and Step 3) is to add the integration from the Team Dashboard of the team which will own the integration. To add an integration directly to a team, navigate to the Team Dashboard and open Integrations tab. Click Add Integration and select the integration that you would like to add.
- Copy the API URL.
- Click Save Integration.

Configuration in SignalFx
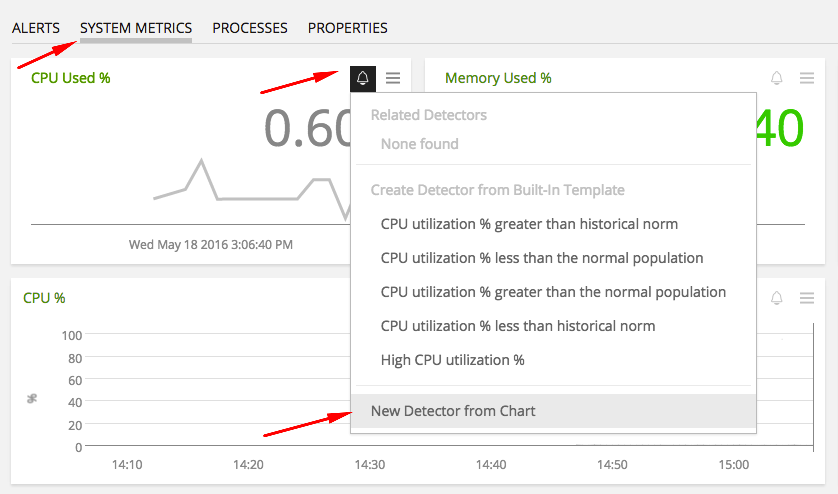
- In SignalFx, open hosts view.
- To create alerts for the total host metrics, open "System Metrics" tab or to create alerts for a specific host, click a host and open "System Metrics" tab.
- Choose a metric to create alerts for and click the bell icon in the upper-right corner.
- Click New Detector From Chart.

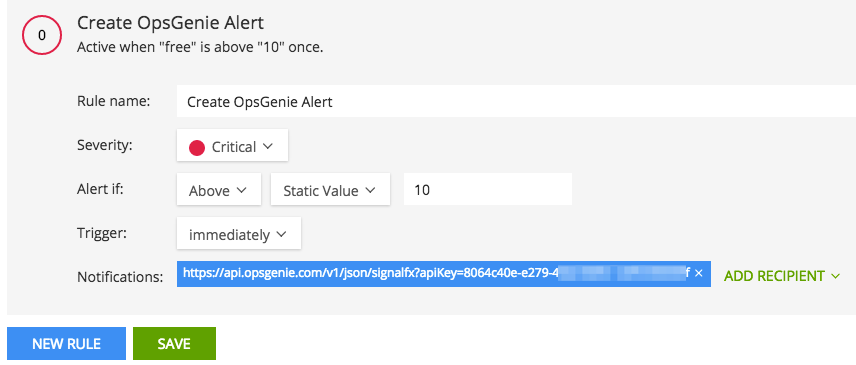
- On the alert screen, populate name, severity, conditions, and trigger duration of the alert.
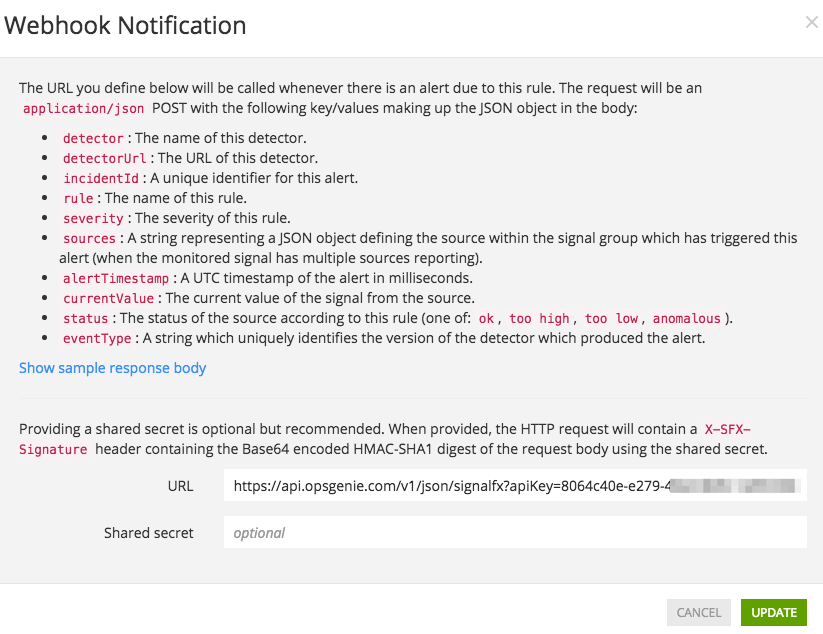
- From the "Notifications" drop-down, choose Webhook.
- Paste API URL into URL field and click UPDATE.

- Click SAVE.

Sample payloads sent from SignalFx to Opsgenie
Sources field of the below content is a string representation of a JSON object. The content of the sources object can differ. That's why whole sources object is added to the available draggable fields to make it possible to extract custom fields from sources object.
To put the dsname field of the sources object to the alert: use {{sources.dsname}}.
{
    "severity": "Critical",
    "sources": "{\"AWSUniqueId\":\"i-274xxxx1_us-west-2_97xxxxxxxx\",\"dsname\":\"value\",\"host\":\"ip-172.us-west-2.compute.internal\",\"plugin\":\"signalfx-metadata\",\"plugin_instance\":\"utilization\",\"sf_metric\":\"memory.utilization\"}",
    "rule": "Create Opsgenie Alert",
    "alertTimestamp": 1463567930000,
    "eventType": "_SF_PLOT_KEY_Ciu5eDlAgAc_9_3",
    "incidentId": "CiYI3ipAgnA",
    "detector": "Memory Used % Detector",
    "detectorUrl": "https://app.signalfx.com/#/detector/Ciu5eDlAgAc/edit",
    "currentValue": "4.07361626150254",
    "status": "too high"
}{
"severity": "Critical",
"sources": "{\"AWSUniqueId\":\"i-2xxx1_us-west-2_974xxxxxxx\",\"dsname\":\"value\",\"host\":\"ip-172-x.us-west-2.compute.internal\",\"plugin\":\"signalfx-metadata\",\"plugin_instance\":\"utilization\",\"sf_metric\":\"memory.utilization\"}",
"rule": "Create Opsgenie Alert",
"alertTimestamp": 1463568222190,
"eventType": "_SF_PLOT_KEY_Ciu5eDlAgAc_9_3",
"incidentId": "CiYI3ipAgnA",
"detector": "Memory Used % Detector",
"detectorUrl": "https://app.signalfx.com/#/detector/Ciu5eDlAgAc/edit",
"currentValue": "4.07361626150254",
"status": "ok"
}Sample alert

Updated 10 months ago
