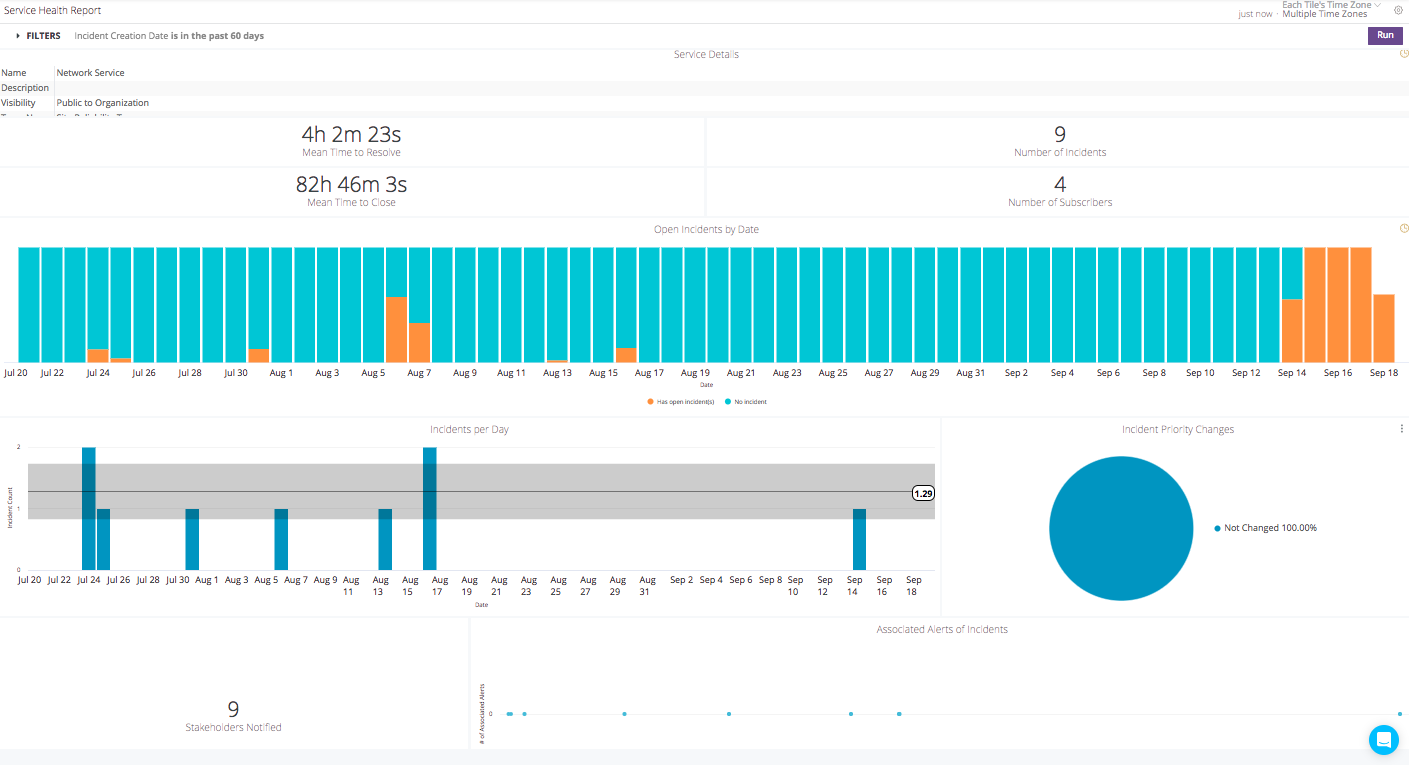
Service Health Reports
Service Health Reports are available under each Service’s configuration page (in the Team Dashboard), on the header of the page. These reports are useful for service-oriented teams to understand the frequency and resolution of incidents in order to improve incident response efforts or to see what is successful during remediation of incidents based on data on the dashboard.

This dashboard includes the analytics surrounding incidents that have occurred in a selected Service. This report is a service-specific report and accessed via the Services details page under a Team.

Filters: Incident Creation Date
Looks
Service Details:
The Name, Description, Visibility, and Team Name of the Service under this report.
Mean Time to Resolve:
Mean time to resolve the incident, i.e, how long it takes to resolve the incidents received in average (per the filter, Incident Creation Date).
Number of Incidents
Total number incidents that occurred in the date range specified.
Mean Time to Close
Mean time to close the incident, i.e, how long it takes to finalize the resolution of the incidents received in average (per the filter, Incident Creation Date).
Number of Subscribers
Total number of individuals subscribed to the selected service.
Open Incidents by Date
A bar graph which shows days which had open incidents. The teal portions represent times of service health with no open incidents, and the orange portions represent times in which services had an open incident. Hover over a bar to see the duration of the open incident.
Drill into a bar to see by Time Hour for service up time visuals compared to down time.
Incidents per Day
A bar graph which shows the date (x-axis) and total number of incidents (y-axis).
Stakeholders Notified
Shows if the Stakeholders are notified or not in Yes/No format.
Incident Priority Changes
A pie chart which displays the percentage of time in which an incident’s priority was changed or not changed.
Associated Alerts of Incidents
A bar graph which shows the Incident Creation Date (x-axis) and # of Associated Alerts (y-axis).
Updated 10 months ago
