LogicMonitor Integration
LogicMonitor’s automated SaaS performance monitoring platform provides IT Ops teams with end-to-end visibility and actionable metrics to manage today’s sophisticated on-premise, hybrid, and cloud infrastructures.

Deploy and manage monitoring tools faster and automatically with AutoDiscovery of devices. Act on infrastructure performance data using built-in and customizable dashboards, performance forecasting, and complete reporting. Use built-in workflow capabilities including alerting routing and escalation management to improve IT team’s issue response and resolution time. Forward LogicMonitor alerts to Opsgenie to notify users via iPhone and Android push notifications, email, SMS, and phone calls, track the alert lifecycle, escalate alerts, etc.
What does Opsgenie offer to LogicMonitor users?
Opsgenie has a native, bidirectional integration with LogicMonitor. Use the integration to automatically sync LogicMonitor with Opsgenie alerts and benefit from Opsgenie's rich alert notification system, escalations, and on-call rotations.
This document describes the basic functionality of the integration, how to configure it, and the details of data exchanged between Opsgenie and LogicMonitor.
Functionality of the integration
- When an alert is created in LogicMonitor, an alert is also created in Opsgenie automatically through the integration.
- When an alert is closed in LogicMonitor, related alert is also closed in Opsgenie.
- When an alert is acknowledged in LogicMonitor, related alert is also acknowledged in Opsgenie.
- When the alert is acknowledged by in Opsgenie, alert is acknowledged automatically in LogicMonitor as well (optional).
Configuring Opsgenie LogicMonitor integration
- Please create an Opsgenie account if you haven't done so already.
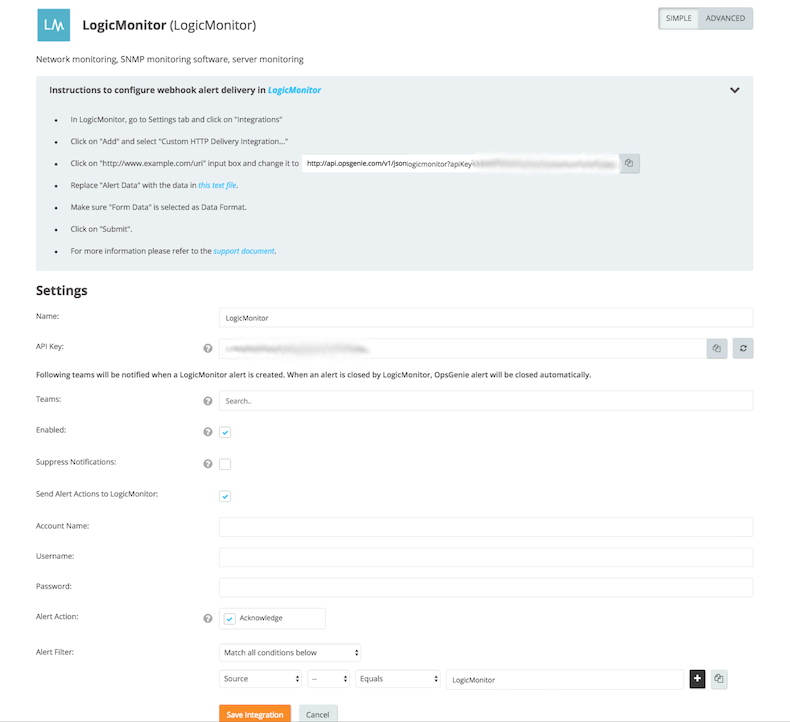
- Go to Opsgenie LogicMonitor Integration page.
For Free and Essentials plans, you can only add the integrations from the Team Dashboards, please use the alternative instructions given below to add this integration.
- Specify who is notified for the LogicMonitor alerts using the Teams field. Auto-complete suggestions are provided as you type.
An alternative for Step 2) and Step 3) is to add the integration from the Team Dashboard of the team which will own the integration. To add an integration directly to a team, navigate to the Team Dashboard and open Integrations tab. Click Add Integration and select the integration that you would like to add.
- Copy the integration URL which includes Opsgenie endpoint as well as the API key.
- Select "Send Alert Actions to LogicMonitor" field to send alert actions in Opsgenie to LogicMonitor.
- If the box is selected, then fill in the related fields. Please note that it may be good to create a user in LogicMonitor that only has an "ackonly" role for sending alert actions from Opsgenie to LogicMonitor.
- Click Save Integration.

Configuring Integration on LogicMonitor
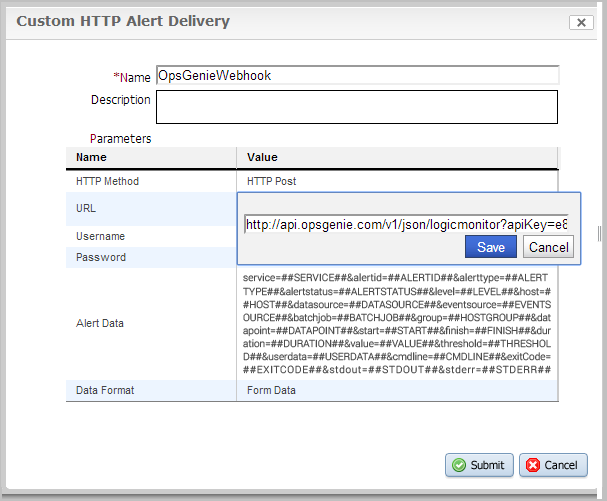
- In LogicMonitor, go to the "Settings" tab and click Integrations.
- Click Add and select Custom HTTP Delivery Integration....
- Populate the URL field with the integration URL copied when saving the integration.
- Replace "Alert Data" with the data in this text file.
- Make sure "Form Data" is selected as Data Format.
- Click Submit.

Sample payloads sent from LogicMonitor to Opsgenie
{
        "alertid": "LMS22",
        "alertstatus": "active",
        "datasource": "WinVolumeUsage-C:\",
        "datapoint": "PercentUsed",
        "date": "2014-05-02 14:21:40 PDT",
        "dsdesc": "Monitors space usage on logical volumes.",
        "dsidesc": null,
        "datapointdesc": "Percentage Used on the volume",
        "group": "group1,group2",
        "host": "opsgenie-test-server",
        "hostdesc": "Server used for testing OpsGenie integrations",
        "instance": "C:\",
        "level": "warning",
        "duration": "1465",
        "threshold": "10",
        "eventsource": "WinVolumeUsage-C:\",
        "eventlogfile": "Application",
        "eventtype": "information",
        "eventmsg": "Percentage used on the volume exceeded 80%",
        "eventlogmsg": "Remaining capacity(1456750MB) of volume C:\ is lower than 25%",
        "eventcode": "1847502394",
        "eventuser": "test-user",
        "value": "83",
        "batchdesc": "Monitors space usage on logical volumes everyday.",
        "hostips": "123.456.789.012",
        "hosturl": "https://opsgenie-test-server.net/",
        "service": "webservice",
        "alerttype": "error",
        "agent": "opsgenie-test-server",
        "checkpoint": "1879234",
        "hostinfo": null,
        "servicedetail": null,
        "serviceurl": "https://opsgenie-test-server.net/",
        "servicegroup": "Functional Testing",
        "clearvalue": "1"
    }
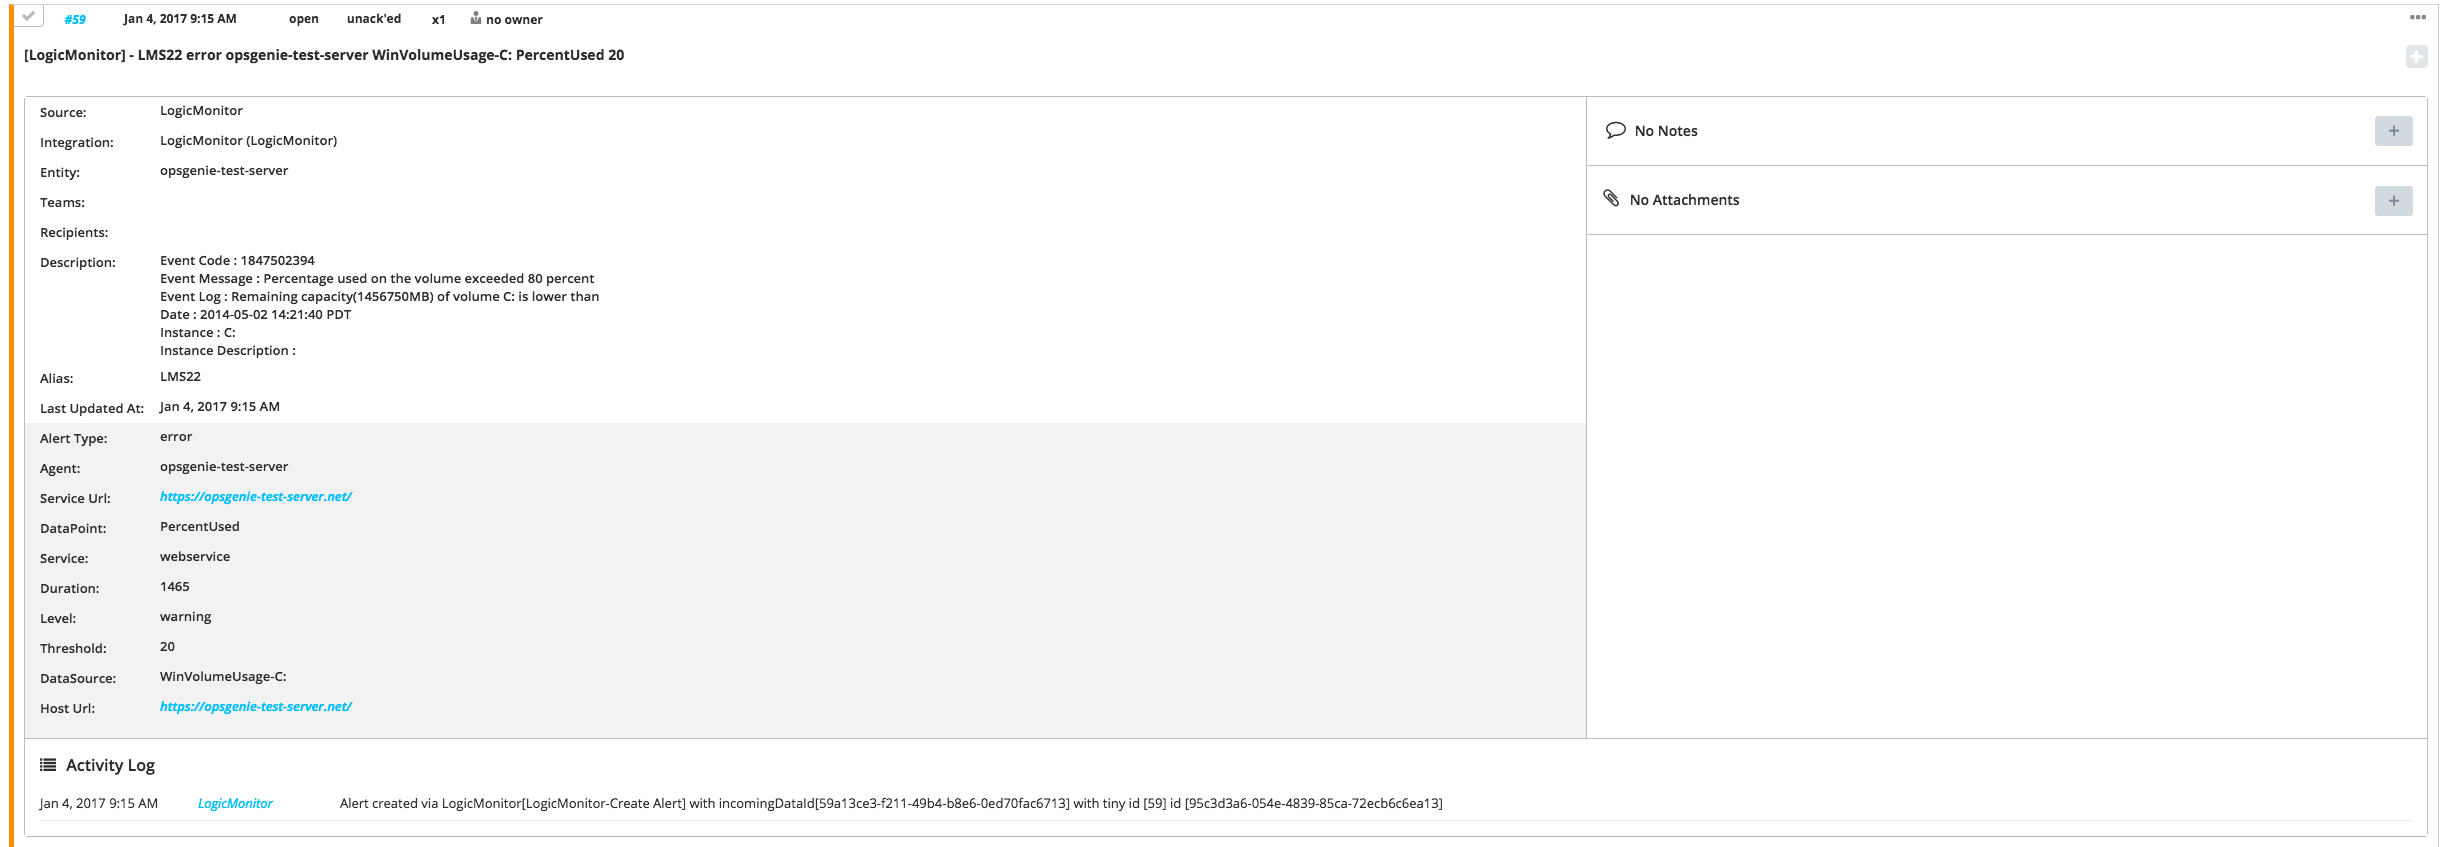
Sample alert

Troubleshooting with Test Alerts
These informational alerts denote that incoming data is for testing purposes only. Since testing data could be different from the expected data, we are directly creating an alert without running our integration flow.
While we are processing a Logic Monitor request, we check whether it is a test request or not. If it’s a test request, we interrupt the integration flow (which populate dynamic fields etc.) and create an alert request with desired parameters (like integration, user -we set it to LogicMonitor-) but integrations parameter themselves and while this request is processing if the integration field is null it is set to DefaultAPI integration (which can’t be removed and guaranteed to exist.) Hence, in the end it’ll become an alert created by default API.
For questions please contact [email protected].
Updated 29 days ago
