Infrastructure Health Reports
Infrastructure may consist of hundreds or thousands of services. Infrastructure Health Reporting conveys the health of each piece, problematic components or services, so focus can be specific for improvements or removals. These reports give a comprehensive look into the health of a huge part of the organization especially if your organization is very service-focused. They provide insight into making (business) decisions based on incident frequency and the data for how business-impacting or easy to solve incidents for a particular service is.
The Infrastructure Reports are available on the Reports page, both in Global and Team Reports.

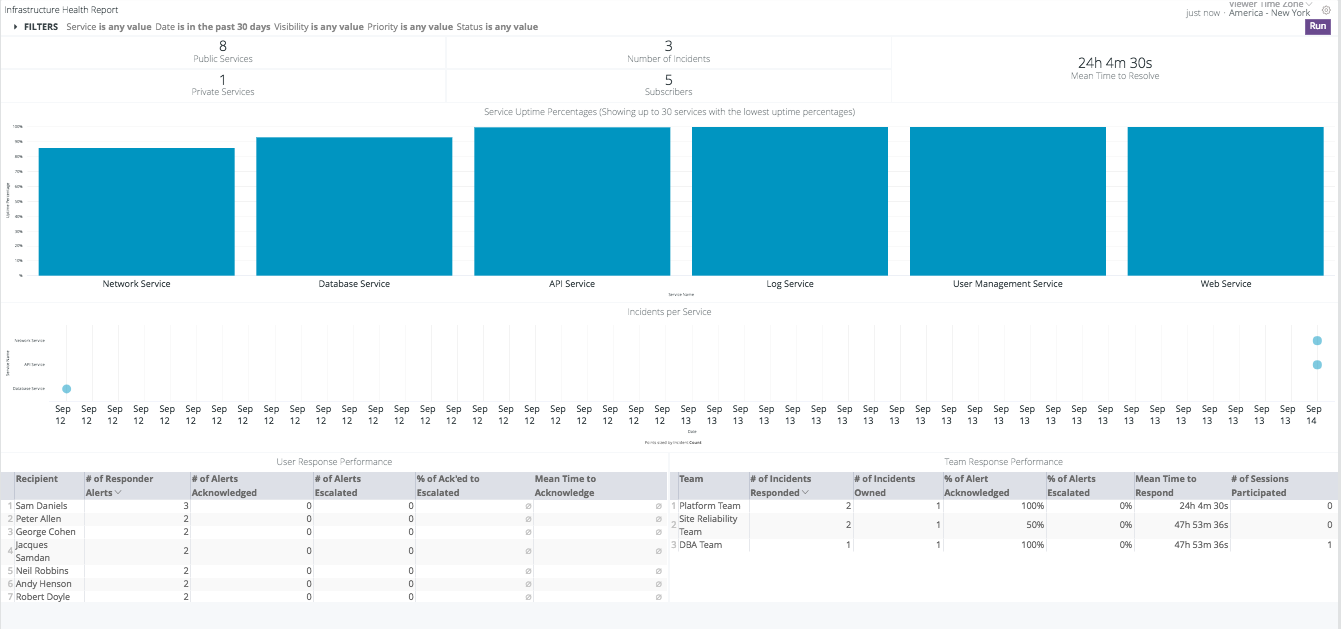
This dashboard shows a comprehensive view of services and the incidents that have occurred in them. There is also information included on response efforts.
Filters: Service, Date, Visibility, Priority, Status
Looks
Public Services
Number of services visible to the organization, stakeholders.
Number of Incidents
Total number of incidents that occurred in the date range specified.
Mean Time to Resolve
Mean time to resolve the incident, i.e, how long it takes to close the incidents received on average (per the filter, Incident Creation Date).
Private Services
Number of services visible only to the owner team and account admins.
Subscribers
Number of individuals subscribed to receive updates on the service.
Service Uptime Percentages
Over the period of time designated by the filter, displays via bar graph what percentage of time services were without incidents. Shows up to 30 services, the ones with the lowest percentage of uptime first.
Incidents per Service
Bar chart displaying how many incidents occurred in each service in the team over the specified date range.
User Response Performance
A table that lists Recipients and includes # of Alerts Acknowledged, Escalated (Yes/No), and number (#) of: Responder Alerts, Alerts Acknowledged, Alerts Escalated, Alerts Ack’ed to Escalated, and Mean Time to Acknowledge.
Team Response Performance
A table that lists Teams and the corresponding information for: number (#) of Incidents Responded, number (#) of Incidents Owned, Percentage (%) of Alert Acknowledged, Percentage (%) of Alerts Escalated, Mean Time to Respond, and number (#) of Sessions Participated.
Updated 10 months ago
