Hosted Graphite Integration
Hosted Graphite is monitoring as a service with useful alerting for development teams who run applications at scale. It provides its users to explore their data on open source Grafana dashboards and get alerts via integrated tools.

What does Opsgenie offer Hosted Graphite users?
Use Opsgenie’s Hosted Graphite Integration to forward Hosted Graphite alerts to Opsgenie. Opsgenie determines the right people to notify based on on-call schedules– notifies via email, text messages (SMS), phone calls, iOS & Android push notifications, and escalates alerts until the alert is acknowledged or closed.
Functionality of the integration
- When an alert is created in Hosted Graphite, an alert is created in Opsgenie.
Add Hosted Graphite Integration in Opsgenie
- Please create an Opsgenie account if you haven't done so already.
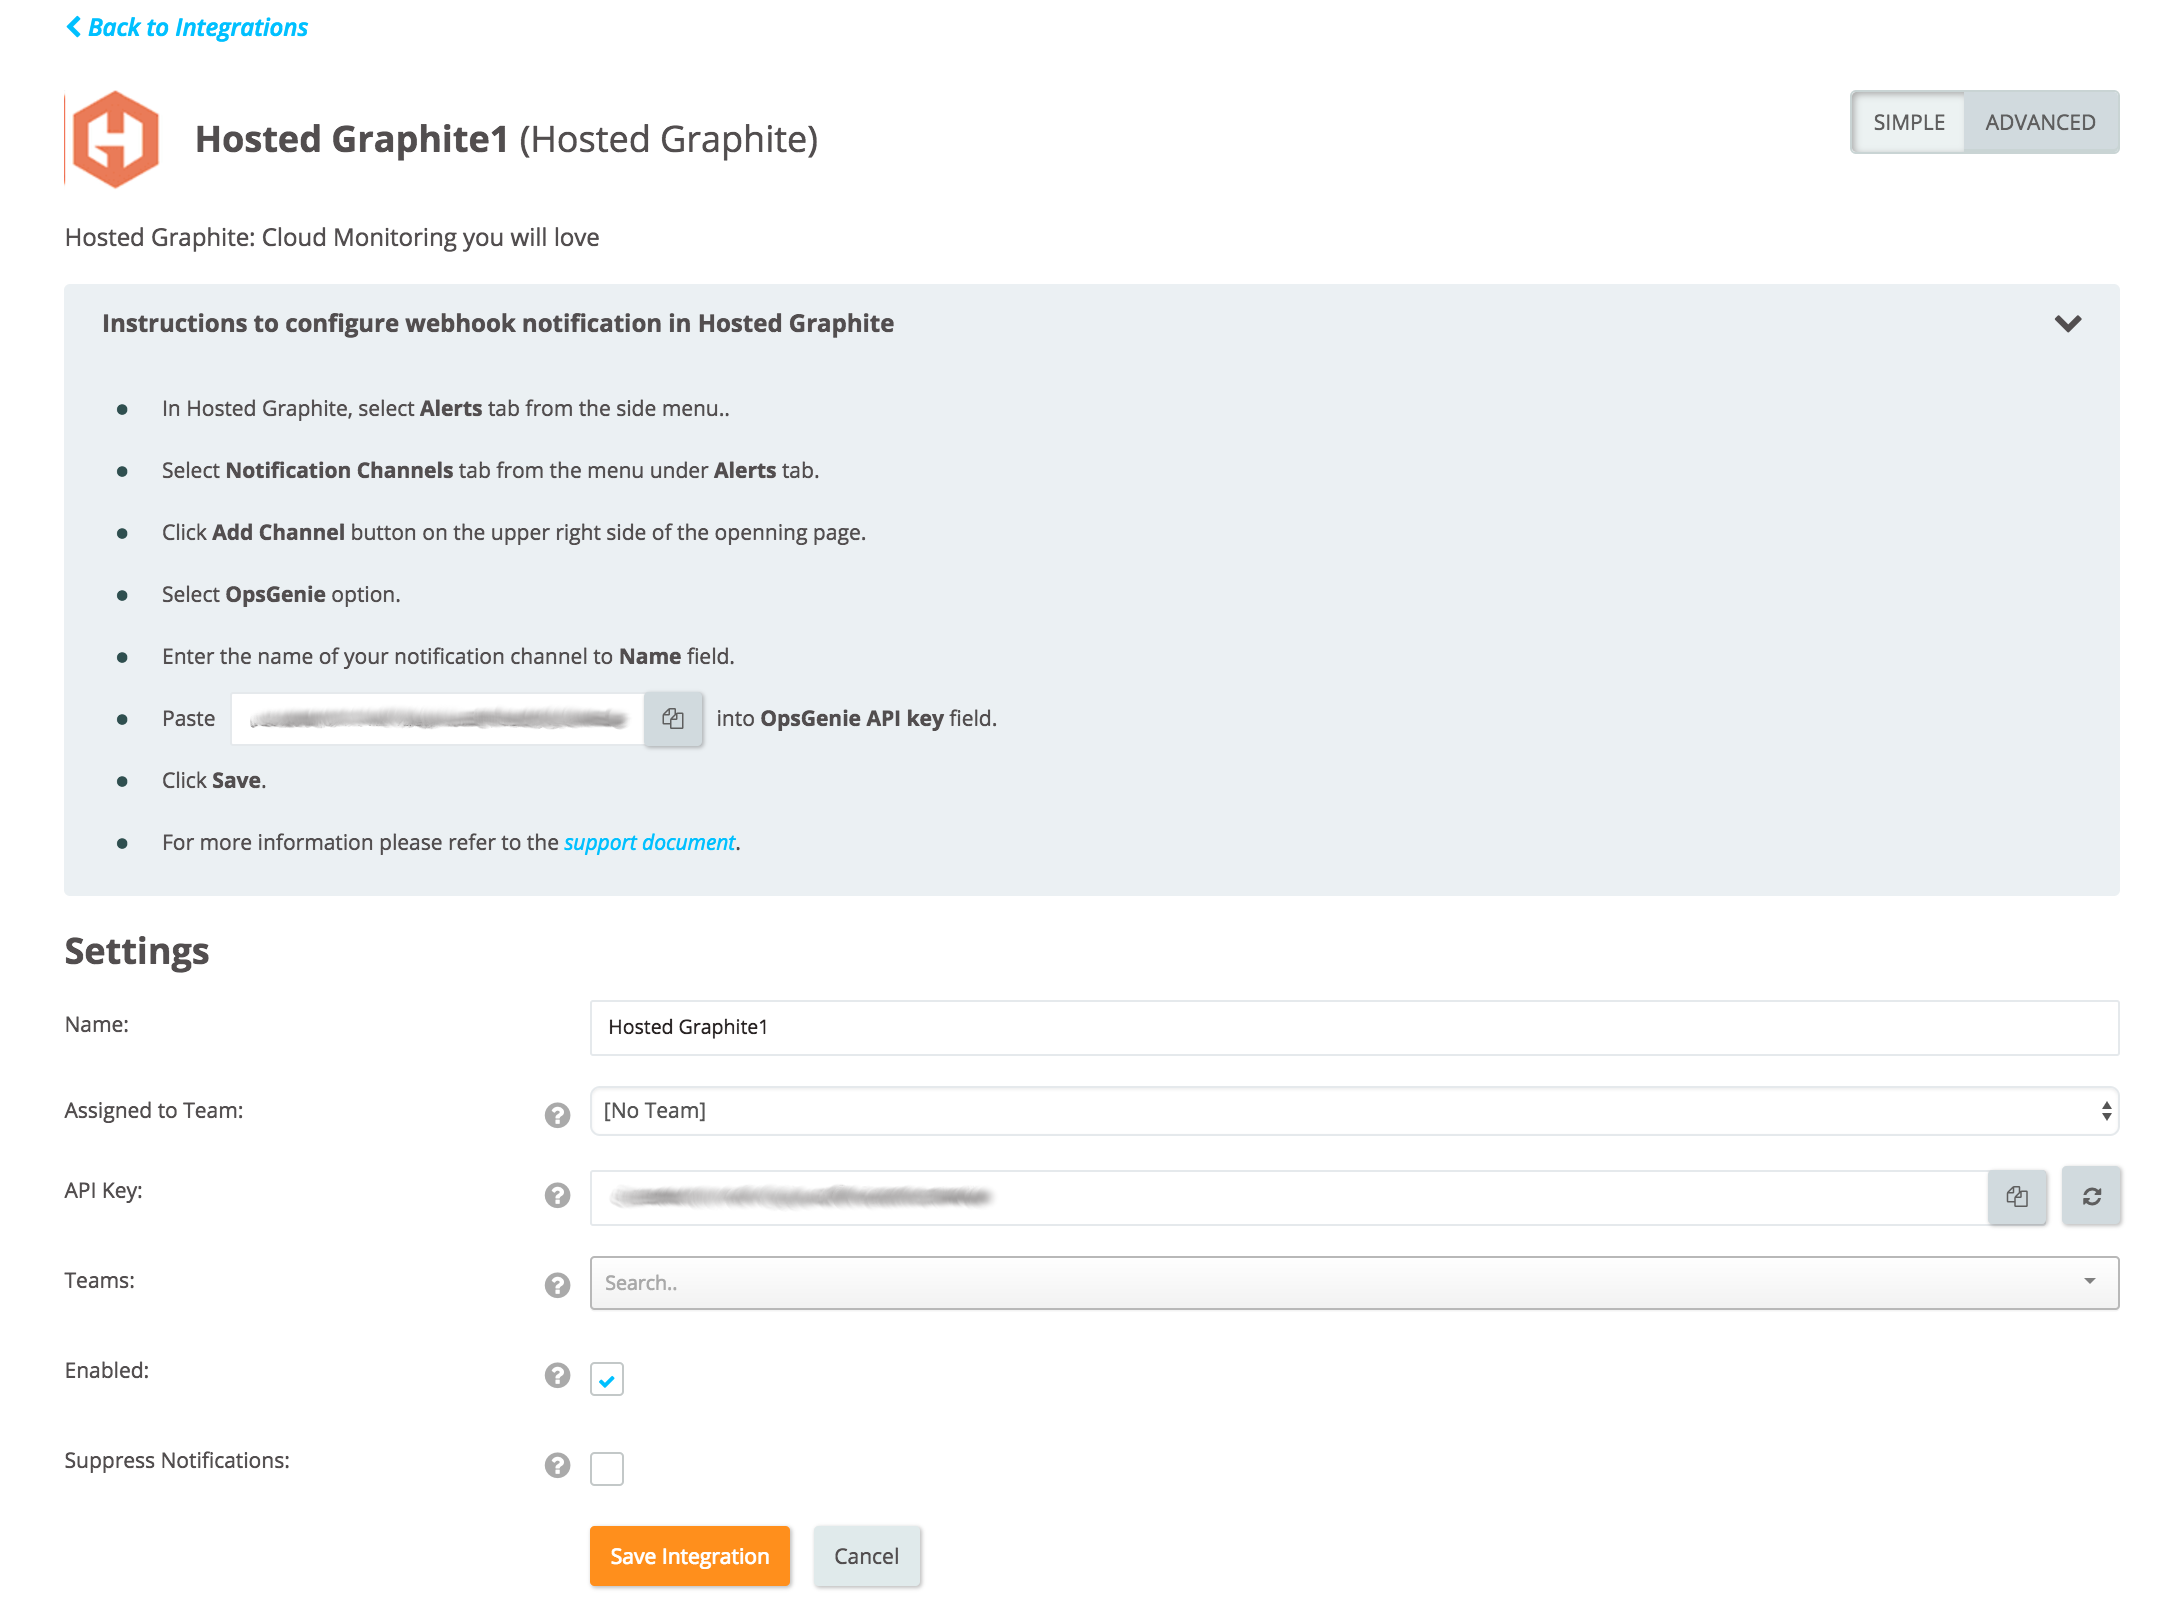
- Go to Opsgenie's Hosted Graphite Integration page.
For Free and Essentials plans, you can only add the integrations from the Team Dashboards, please use the alternative instructions given below to add this integration.
- Specify who is notified of Hosted Graphite alerts using the Teams field. Autocomplete suggestions are provided as you type.
An alternative for Step 2) and Step 3) is to add the integration from the Team Dashboard of the team which will own the integration. To add an integration directly to a team, navigate to the Team Dashboard and open Integrations tab. Click Add Integration and select the integration that you would like to add.
- Copy the API Key.
- Click Save Integration.

Configuration in Hosted Graphite
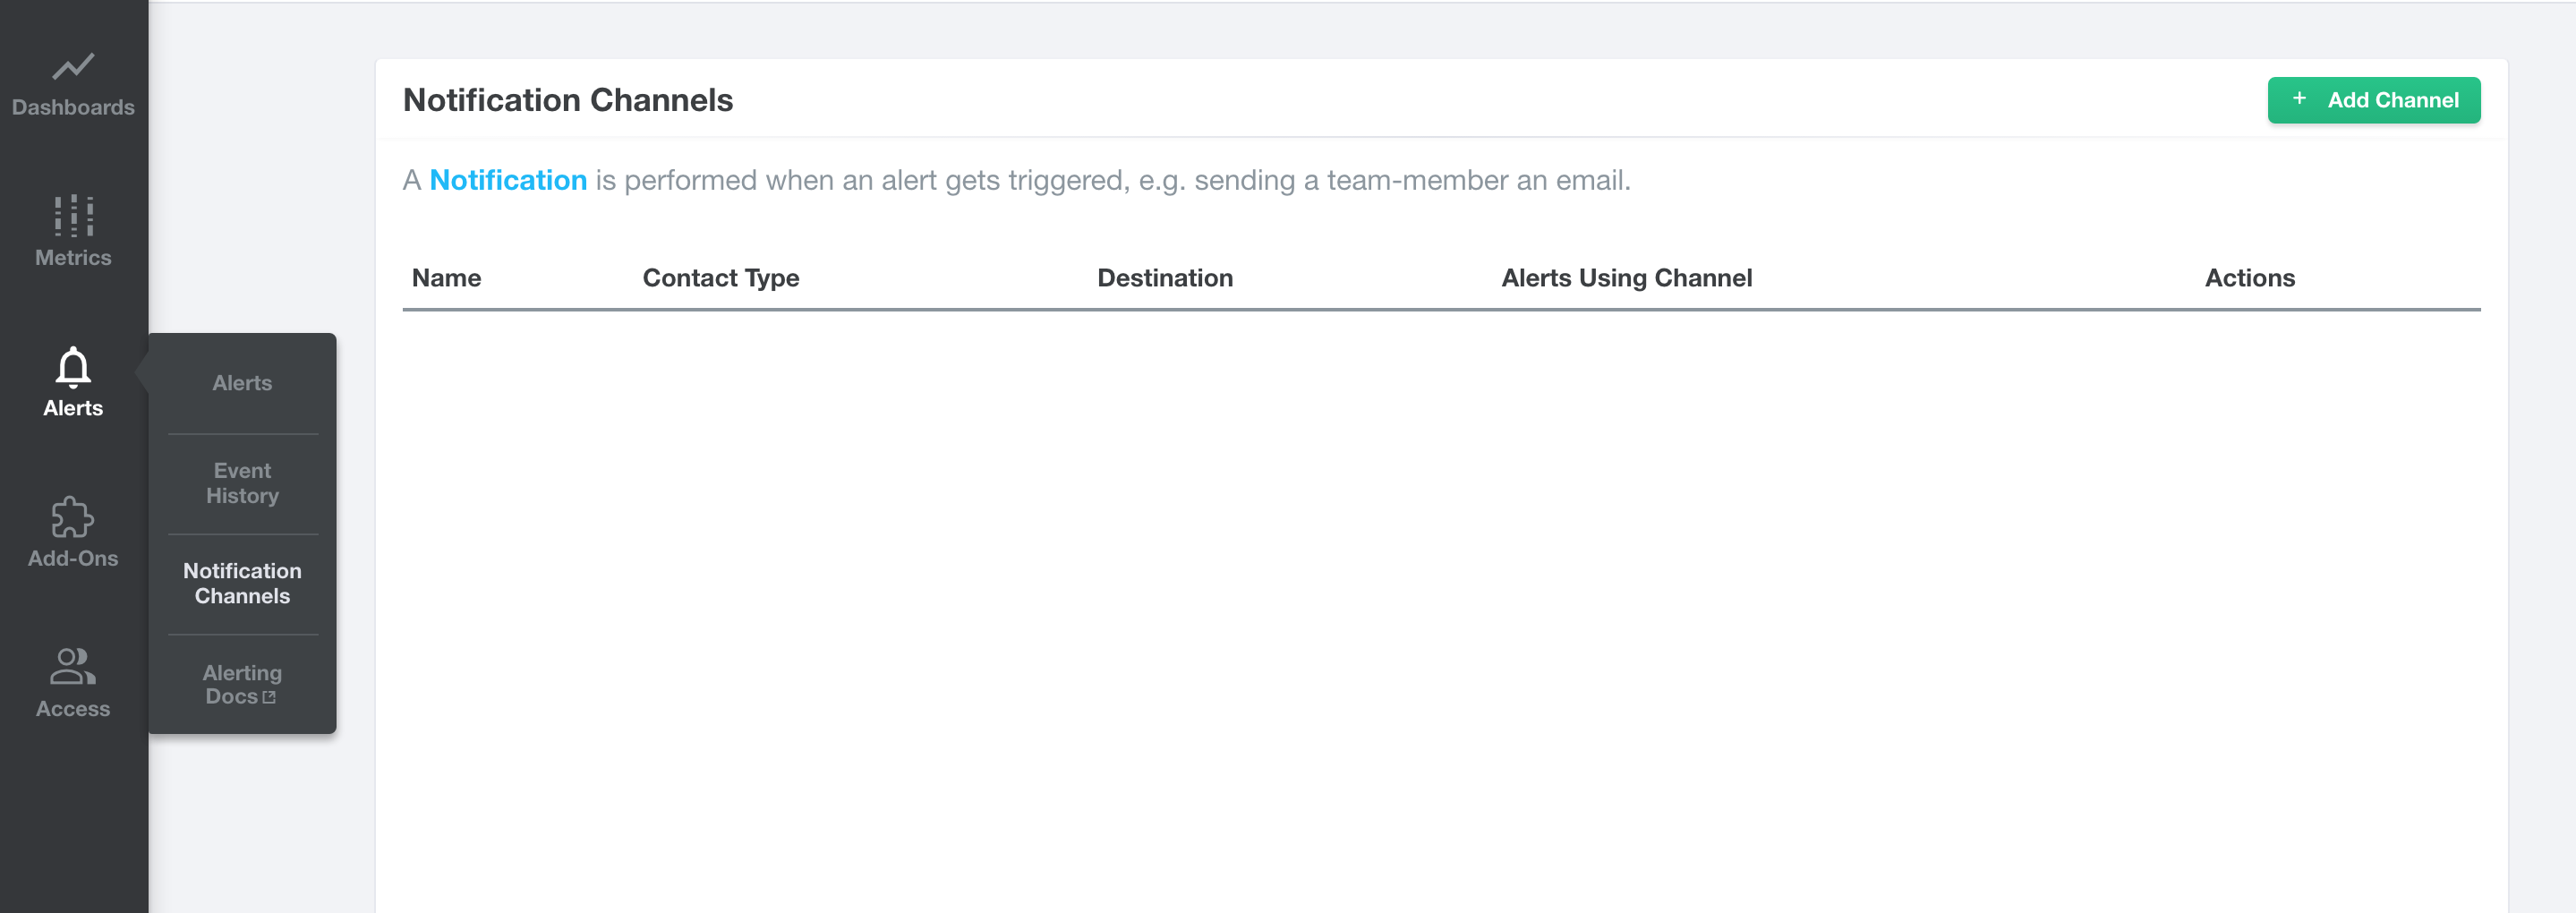
- In Hosted Graphite, go to Notification Channels.
- Click + Add Channel.

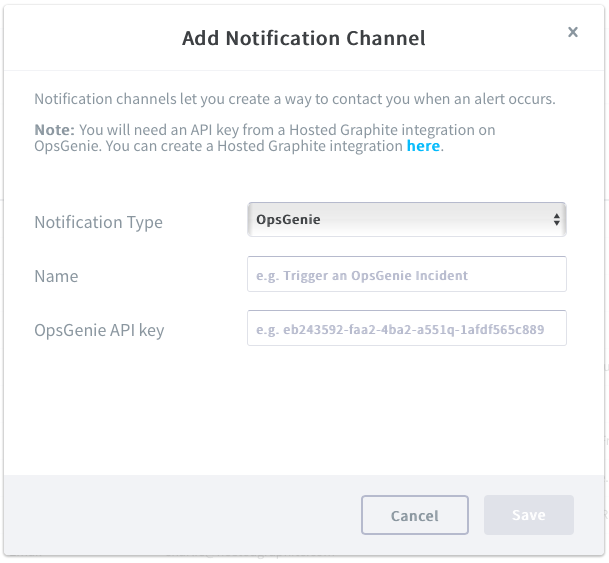
- Select Opsgenie option from Notification Type.
- Enter the name of your notification channel to Name field.
- Paste the API Key you copied from Opsgenie into Opsgenie API key.
- Click Save.


Sample payload sent from Hosted Graphite
Create Alert payload:
{
    "name": "hostedgraphite_test_alert",
    "criteria": "metric values missing for 1 minutes",
    "graph": "http://i.mfhg.io/render-api/e3c33750/035359b9aefe772.png",
    "value": "None",
    "metric": "_test-data.servers.webserver0.requests.count",
    "status": "alerting",
    "backoff_minutes": false,
    "info": "Instructions regarding the alert"
}
This payload is parsed by Opsgenie as:
{
    "alarmName": "test",
    "alarmCriteria": "metric values missing for 1 minutes",
    "alarmValue": "None",
    "alarmMetric": "_test-data.servers.webserver0.requests.count",
    "alarmStatus": "alerting",
    "alarmInfo": "Instructions regarding the alert"
}
Close Alert payload:
{
    "name": "hostedgraphite_test_alert",
    "criteria": "metric values missing for 1 minutes",
    "graph": "http://i.mfhg.io/render-api/e3c33750/035359b9aefe772.png",
    "value": "None",
    "metric": "_test-data.servers.webserver0.requests.count",
    "status": "recovered",
    "backoff_minutes": false,
    "info": "Instructions regarding the alert"
}
This payload is parsed by Opsgenie as:
{
    "alarmName": "test",
    "alarmCriteria": "metric values missing for 1 minutes",
    "alarmValue": "None",
    "alarmMetric": "_test-data.servers.webserver0.requests.count",
    "alarmStatus": "recovered",
    "alarmInfo": "Instructions regarding the alert"
}
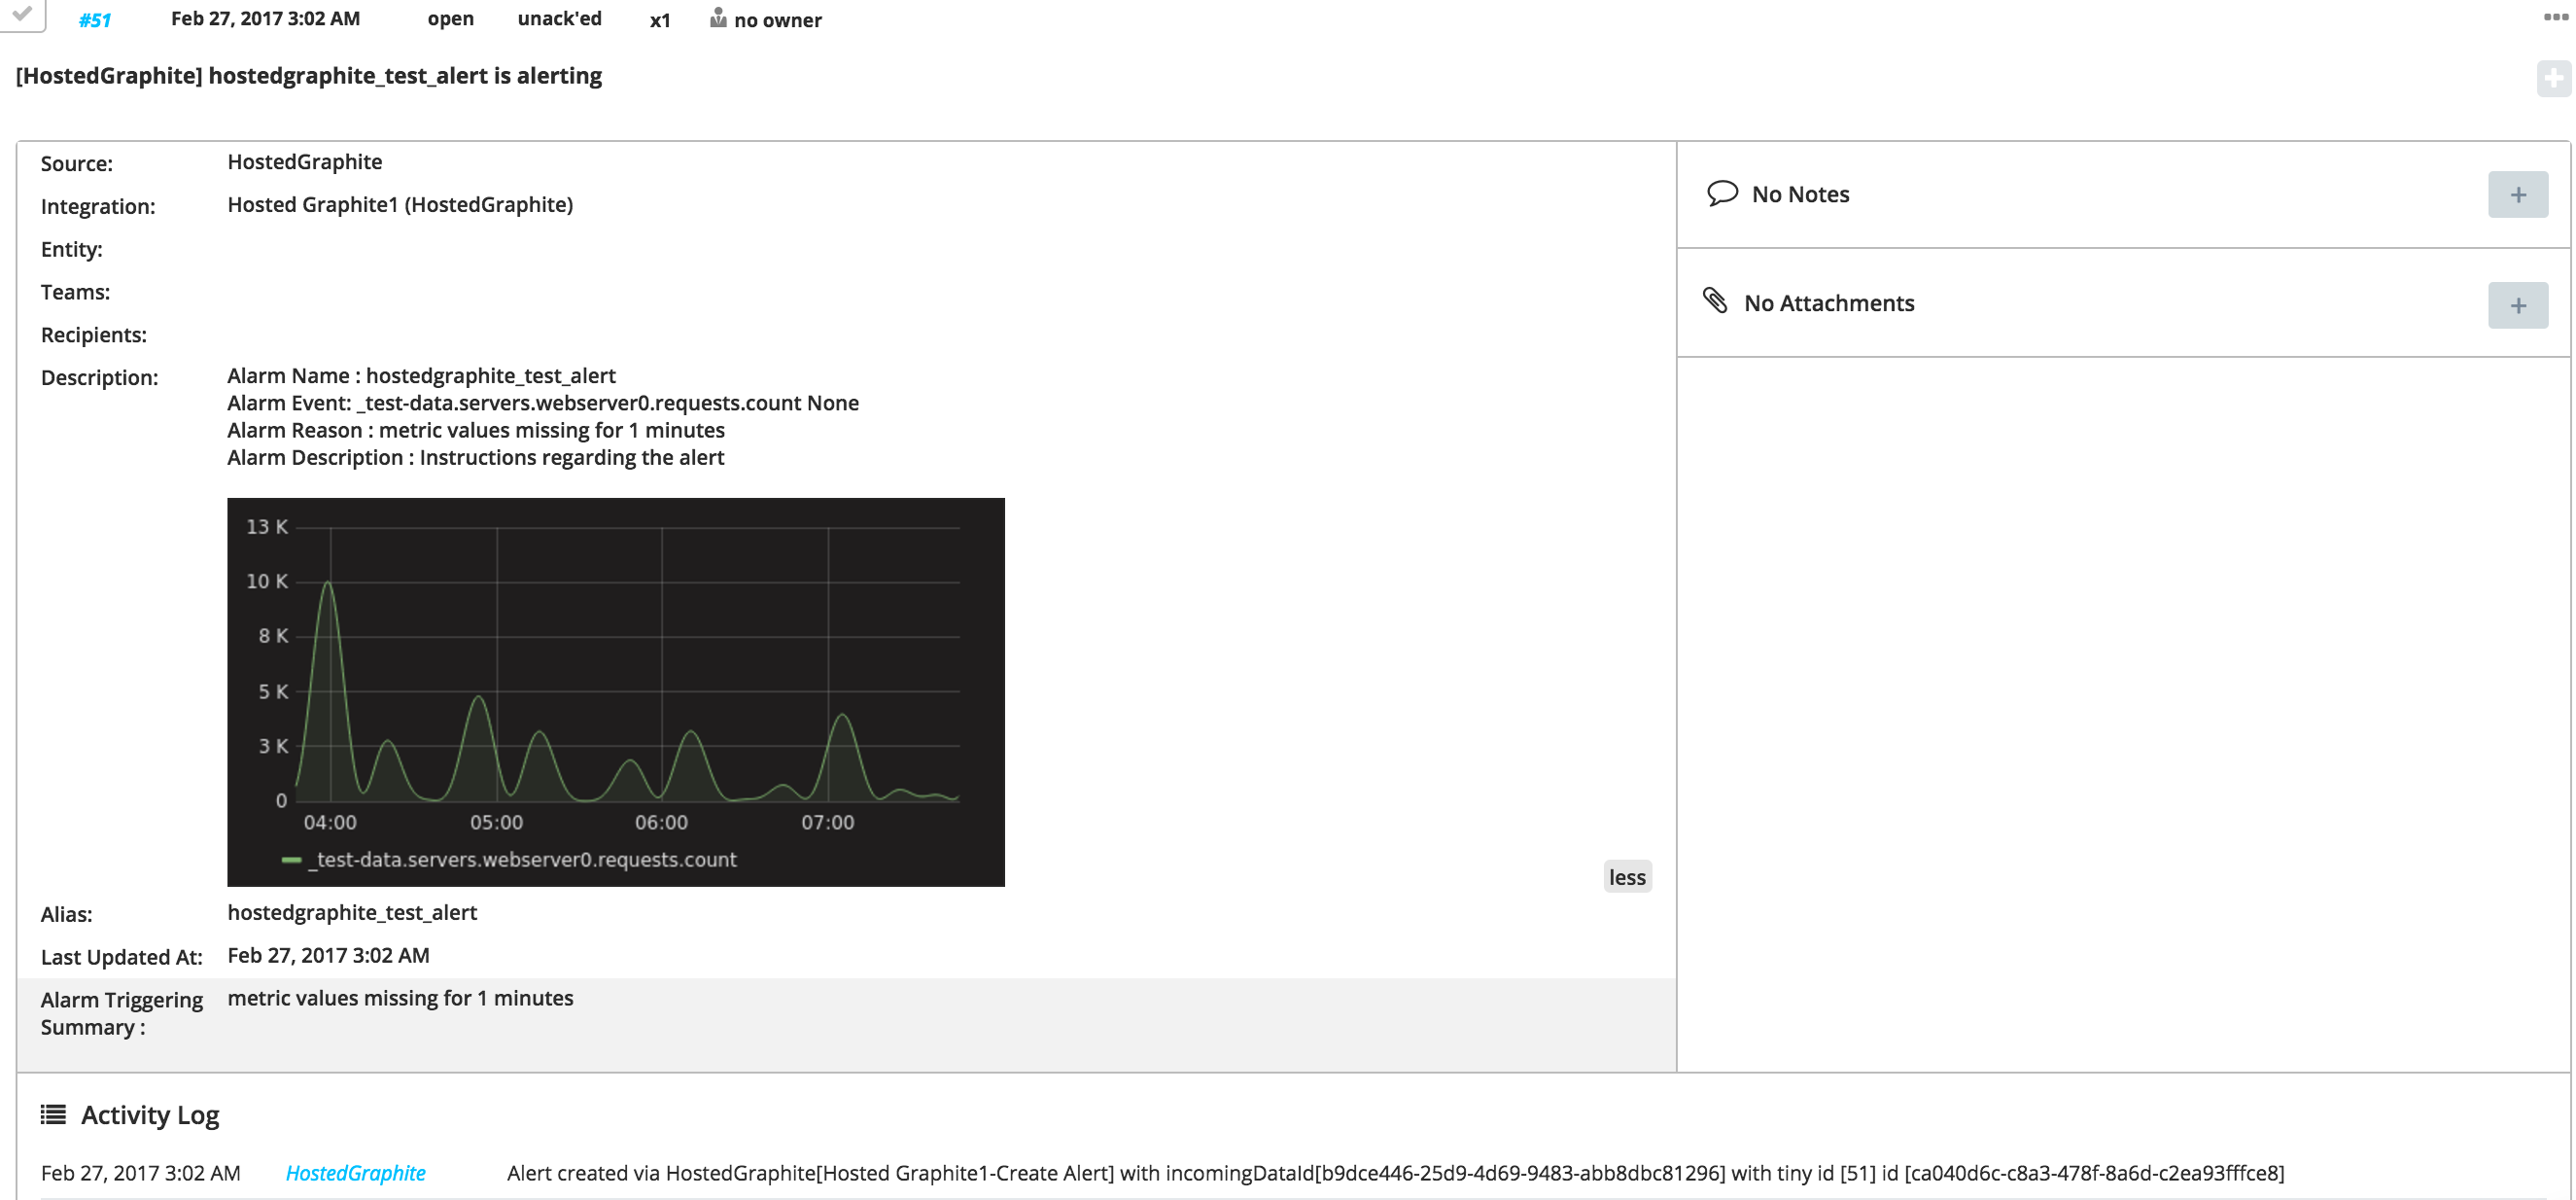
Sample Alert

Updated 10 months ago
