Check_MK Integration
Check_MK is an extension to the Nagios monitoring system that allows creating rule-based configurations using Python and offloading work from the Nagios core to make it scale better, allowing more systems to be monitored from a single Nagios server.

What does Opsgenie offer Check_MK users?
Use Opsgenie's Check_MK Integration to forward Check_MK notifications to Opsgenie. Opsgenie determines the right people to notify based on on-call schedules– notifies via email, text messages (SMS), phone calls and iOS & Android push notifications, and escalates alerts until the alert is acknowledged or closed.
Functionality of the integration
- When a host or service state becomes down in Check_MK, an alert is created in Opsgenie.
- When the problem is acknowledged in Check_MK, the alert is acknowledged in Opsgenie.
- When the state of host becomes UP or the state of service becomes OK again in Check_MK, the alert is closed in Opsgenie.
Add Check_MK Integration in Opsgenie
- Please create an Opsgenie account if you haven't done so already.
- Go to Opsgenie Check_MK Integration page.
For Free and Essentials plans, you can only add the integrations from the Team Dashboards, please use the alternative instructions given below to add this integration.
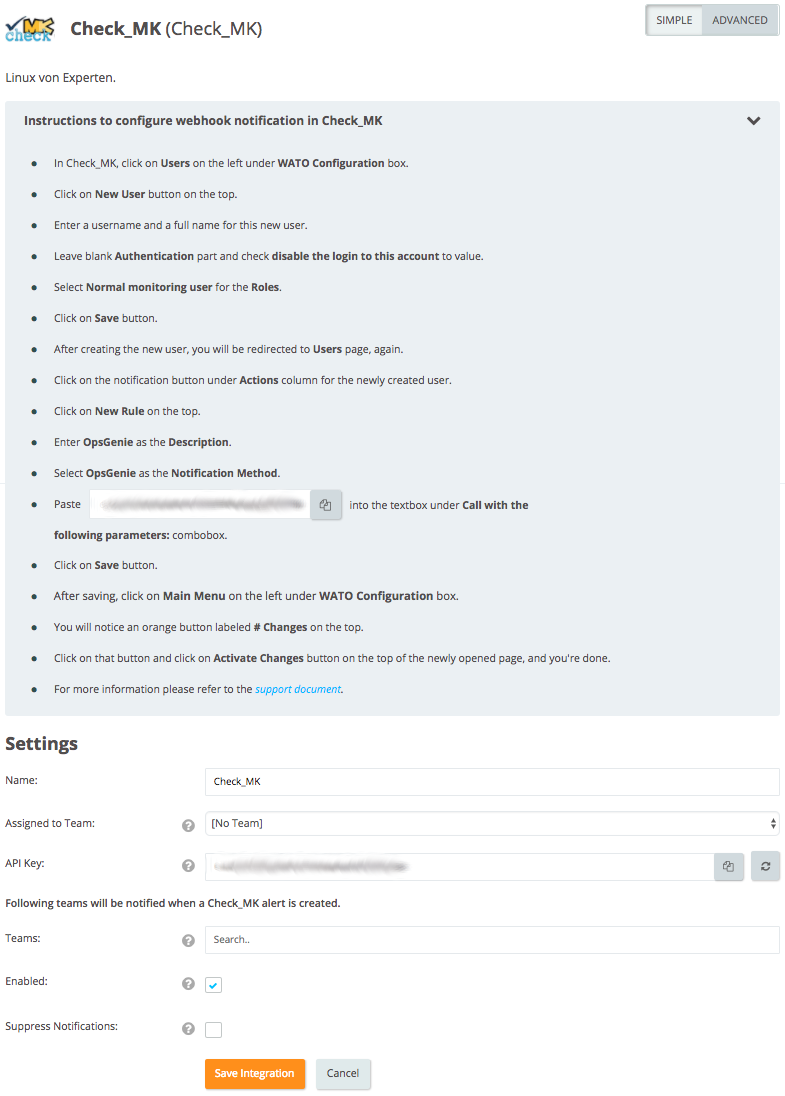
- Specify who is notified for Check_MK alerts using the Teams field. Auto-complete suggestions are provided as you type.
An alternative for Step 2) and Step 3) is to add the integration from the Team Dashboard of the team which will own the integration. To add an integration directly to a team, navigate to the Team Dashboard and open Integrations tab. Click Add Integration and select the integration that you would like to add.
- Click Save Integration.

Opsgenie Check_MK Plugin
- Get Opsgenie Check_MK integration plugin from here.
- Give the necessary permissions to the script using the command below:
sudo chmod +x opsgenie- Put the plugin under the directory,
- /omd/sites/[site name]/local/share/check_mk/notifications/ if you're using OMD version.
- /usr/share/check_mk/notifications if you're using standalone version.
Configuration in Check_MK
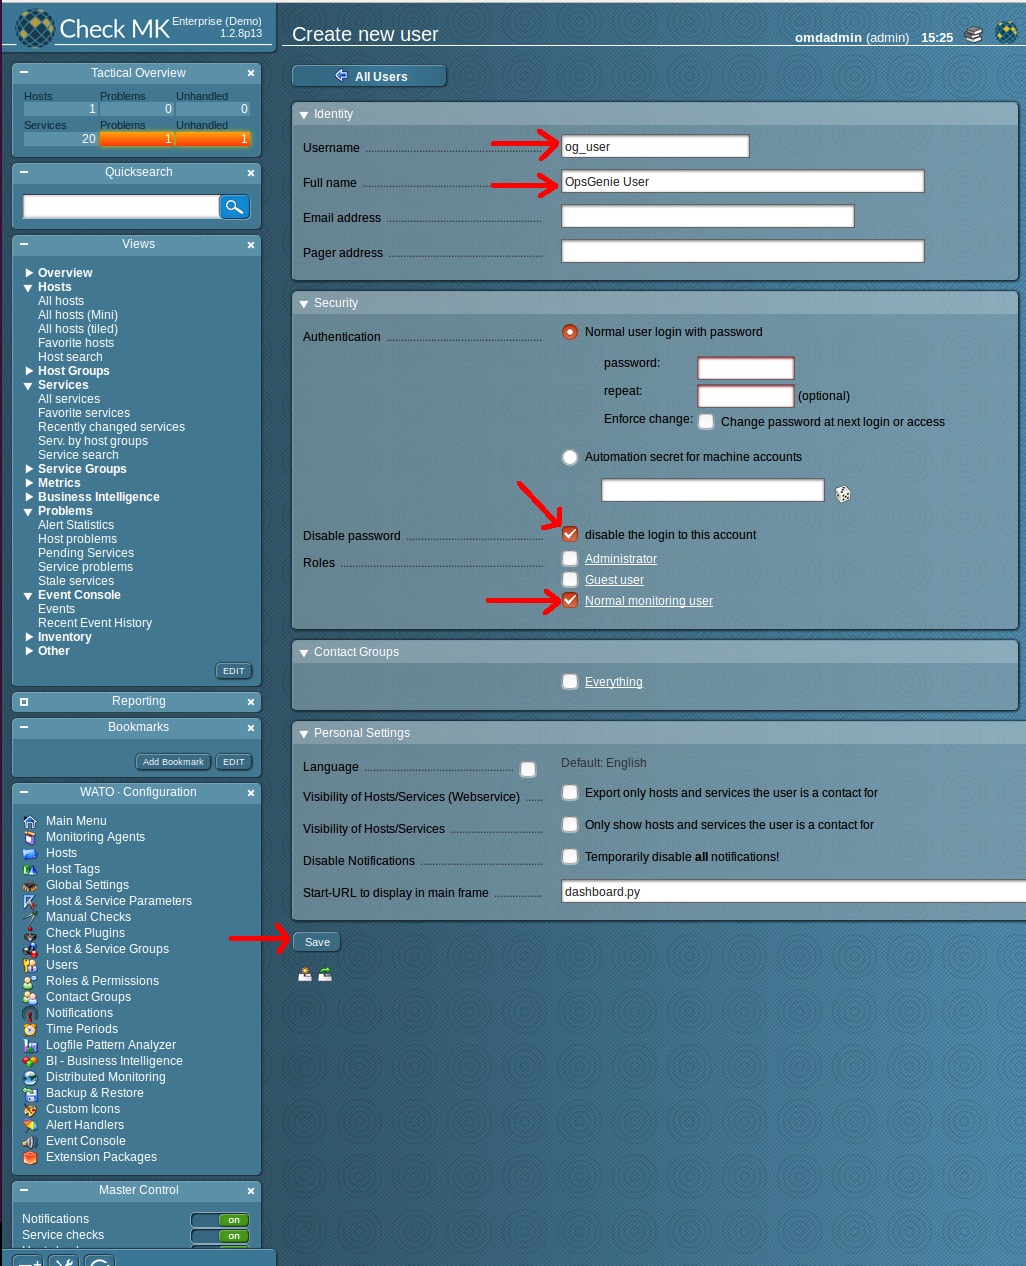
- In Check_MK, click Users on the left under the WATO Configuration box.
- Click New User at the top.
- Enter a username and a full name for this new user.
- Leave the Authentication part blank and check disable the login to this account to value.
- Select Normal monitoring user for the Roles.
- Click Save.

- After creating the new user, you are redirected to Users page again.
- Click on the notification button under Actions column for the newly created user.

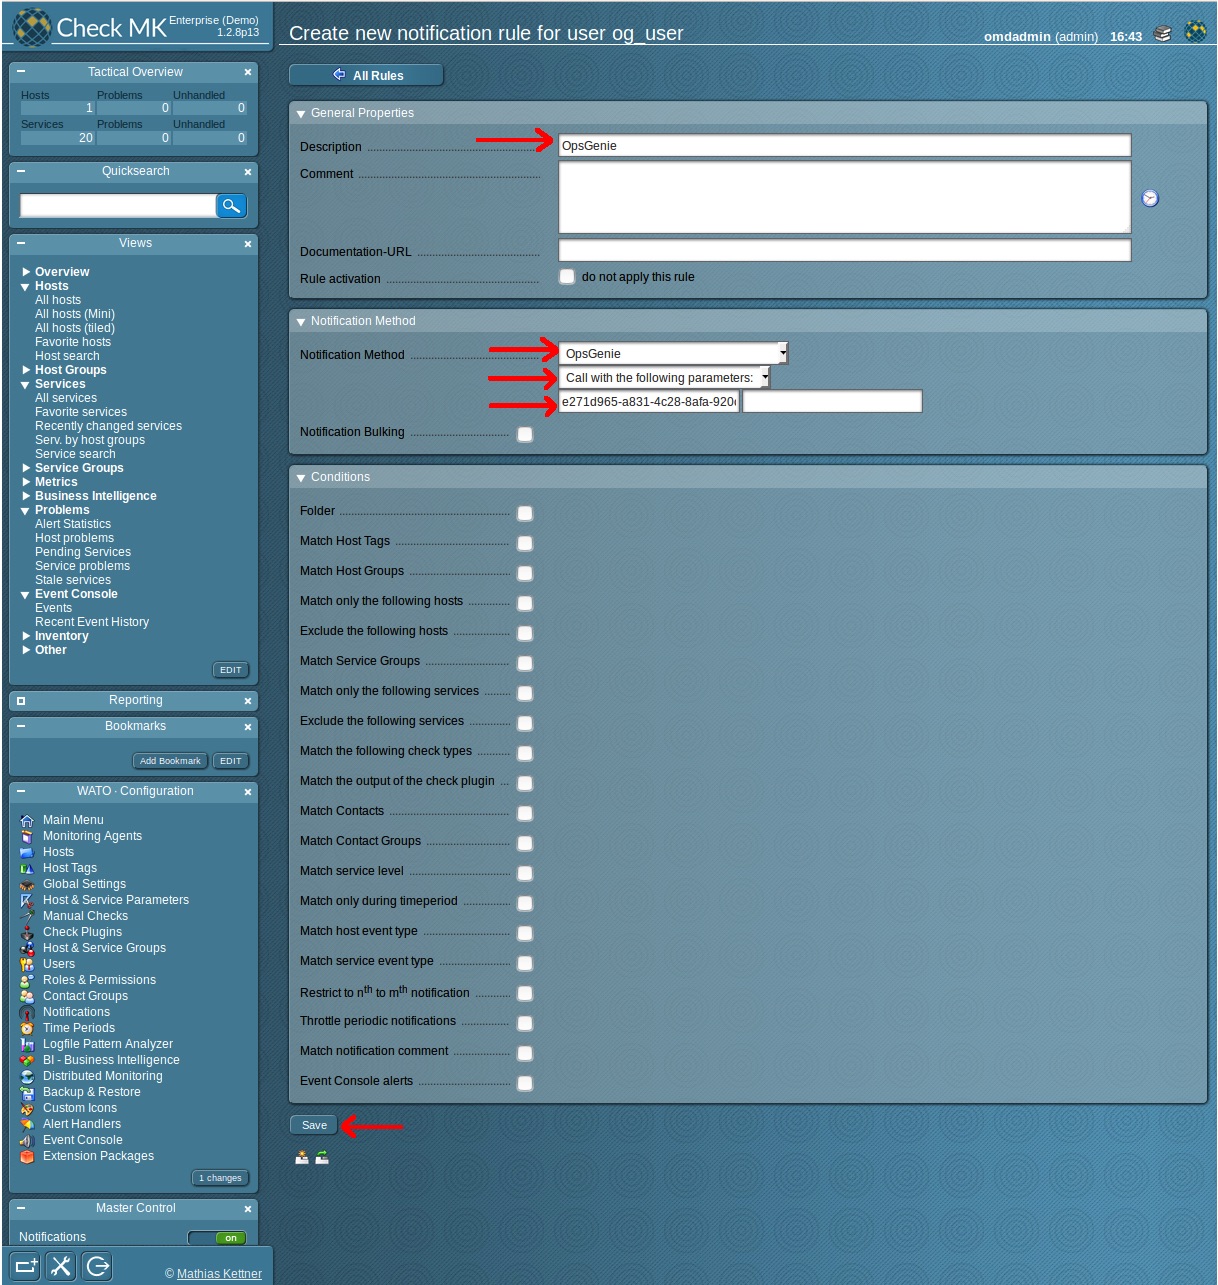
- Click New Rule at the top.
- Enter Opsgenie as the Description.
- Select Opsgenie as the Notification Method.
- Paste your Opsgenie API URL into the textbox under Call with the following parameters: combobox.
- Click Save.

- After saving, click on Main Menu on the left under WATO Configuration box.
- Click the orange button labeled # Changes at the top.
- Click Activate Changes at the top of the newly opened page.


All set! Now your Check_MK integration is configured.
Sample Webhook Message from Opsgenie Check_MK Plugin
{
    "LASTSERVICESTATECHANGE_REL": "0d 00:00:01",
    "LASTSERVICESTATE": "OK",
    "HOSTCHECKCOMMAND": "check-mk-host-smart",
    "HOSTSTATE": "UP",
    "LASTHOSTUP_REL": "0d 00:00:03",
    "HOSTNOTESURL": "",
    "SERVICEDESC": "CPU utilization",
    "SERVICEPERFDATA": "user=88.272;;;; system=11.728;;;; wait=0.000;;;; steal=0;;;; guest=0;;;;",
    "HOSTTAGS": "/wato/ cmk-agent ip-v4 ip-v4-only lan prod site:og tcp wato",
    "HOSTPERFDATA": "",
    "SERVICEATTEMPT": "1",
    "LASTHOSTSHORTSTATE": "UP",
    "NOTIFICATIONCOMMENT": "",
    "SERVICESHORTSTATE": "CRIT",
    "MAXSERVICEATTEMPTS": "1",
    "MAIL_COMMAND": "mail -s '\$SUBJECT\\\$' '\$CONTACTEMAIL\\\$'",
    "HOSTNAME": "localhost",
    "LASTHOSTSTATECHANGE": "1478611924",
    "SERVICESTATE": "CRITICAL",
    "SERVICEGROUPNAMES": "",
    "SERVICENOTESURL": "",
    "SERVICEACKCOMMENT": "",
    "HOST_TAGS": "/wato/ cmk-agent ip-v4 ip-v4-only lan prod site:og tcp wato",
    "SHORTDATETIME": "2016-11-10 13:20:42",
    "CONTACTPAGER": "",
    "LASTSERVICESTATECHANGE": "1478773242",
    "LONGSERVICEOUTPUT": "",
    "HOSTPROBLEMID": "0",
    "CONTACTNAME": "opsgenie",
    "LONGHOSTOUTPUT": "",
    "MONITORING_HOST": "ubuntu-pc",
    "HOSTATTEMPT": "1",
    "SERVICEFORURL": "CPU%20utilization",
    "WHAT": "SERVICE",
    "HOSTALIAS": "localhost",
    "SERVICE_EC_CONTACT": "",
    "SERVICEACKAUTHOR": "",
    "HOST_FILENAME": "/wato/hosts.mk",
    "SERVICECHECKCOMMAND": "check_mk-kernel.util",
    "LASTSERVICESTATEID": "0",
    "LASTSERVICEOK": "1478773181",
    "HOSTDOWNTIME": "0",
    "SERVICEPROBLEMID": "48",
    "HOST_SL": "",
    "NOTIFICATIONAUTHORALIAS": "",
    "HOST_ADDRESS_4": "127.0.0.1",
    "HOST_ADDRESS_6": "",
    "SERVICEOUTPUT": "CRIT - user: 88.3%, system: 11.7%, wait: 0.0%, steal: 0.0%, guest: 0.0%, total: 100.0% (warn/crit at 40.0%/60.0%)(!!)",
    "CONTACTALIAS": "OpsGenie",
    "HOSTADDRESS": "127.0.0.1",
    "SERVICENOTIFICATIONNUMBER": "1",
    "SERVICEDOWNTIME": "0",
    "NOTIFICATIONAUTHORNAME": "",
    "HOSTGROUPNAMES": "check_mk",
    "HOSTSHORTSTATE": "UP",
    "HOSTNOTIFICATIONNUMBER": "1",
    "OMD_ROOT": "/omd/sites/og",
    "LASTHOSTSTATECHANGE_REL": "1d 20:48:39",
    "PREVIOUSHOSTHARDSTATEID": "0",
    "LASTSERVICESHORTSTATE": "OK",
    "CONTACTEMAIL": "",
    "PREVIOUSSERVICEHARDSHORTSTATE": "OK",
    "HOST_ADDRESS_FAMILY": "4",
    "HOSTACKAUTHOR": "",
    "HOSTURL": "/check_mk/index.py?start_url=view.py%3Fview_name%3Dhoststatus%26host%3Dlocalhost",
    "HOSTSTATEID": "0",
    "MICROTIME": "1478773242189620",
    "LASTSERVICEPROBLEMID": "48",
    "PREVIOUSSERVICEHARDSTATE": "OK",
    "SERVICEDISPLAYNAME": "CPU utilization",
    "NOTIFICATIONTYPE": "PROBLEM",
    "LOGDIR": "/omd/sites/og/var/check_mk/notify",
    "MAXHOSTATTEMPTS": "1",
    "OMD_SITE": "og",
    "HOSTACKCOMMENT": "",
    "PREVIOUSSERVICEHARDSTATEID": "0",
    "SERVICE_SL": "",
    "DATE": "2016-11-10",
    "HOSTOUTPUT": "Packet received via smart PING",
    "NOTIFICATIONAUTHOR": "",
    "HOSTFORURL": "localhost",
    "LASTHOSTSTATEID": "0",
    "SERVICESTATEID": "2",
    "LASTHOSTUP": "1478773240",
    "PREVIOUSHOSTHARDSTATE": "UP",
    "LASTSERVICEOK_REL": "0d 00:01:02",
    "HOSTCONTACTGROUPNAMES": "all",
    "HOST_EC_CONTACT": "",
    "SERVICECONTACTGROUPNAMES": "all",
    "CONTACTS": "opsgenie",
    "LASTHOSTPROBLEMID": "0",
    "SVC_SL": "",
    "LASTHOSTSTATE": "UP",
    "PREVIOUSHOSTHARDSHORTSTATE": "UP",
    "LONGDATETIME": "Thu Nov 10 13:20:42 +03 2016",
    "SERVICEURL": "/check_mk/index.py?start_url=view.py%3Fview_name%3Dservice%26host%3Dlocalhost%26service%3DCPU%20utilization"
}
Sample alert

Updated 9 months ago
