Alert Reports
Team-based Alert Reports contain the following dashboards:
1- Alert Analytics
2- Team Productivity Analytics
3- User Productivity Analytics
1- Alert Analytics


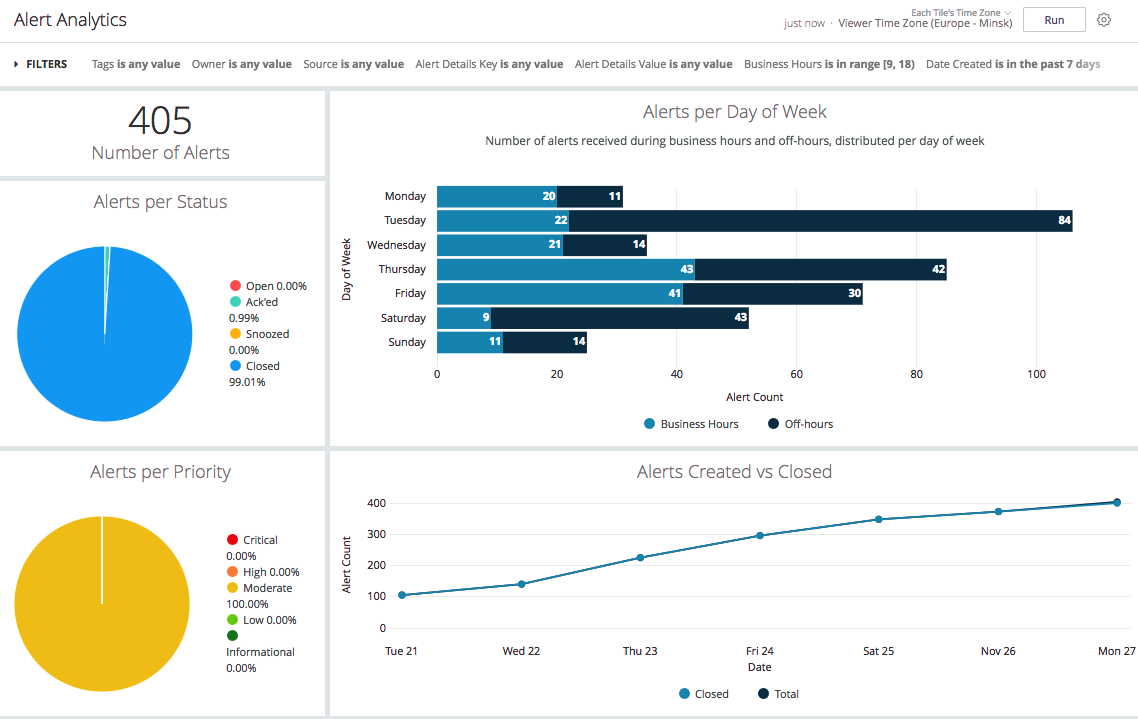
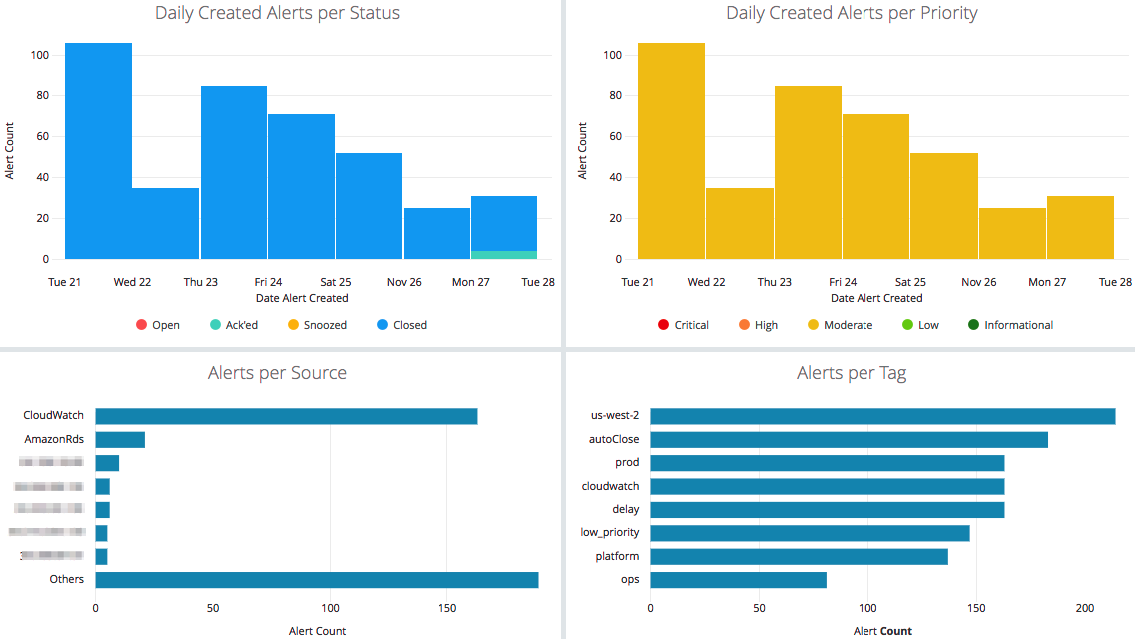
This dashboard includes the alert analytics for the alerts created over a designated period of time, based on different attributes such as status, priority, tags and time intervals. It is automatically filtered by the team selected on the side menu. Please refer to this document for the details of the common looks that this dashboard has with the Global Alert Analytics dashboard.
Filters: Tags, Owner, Source, Alert Details Key, Alert Details Value, Date Created
This team-based report has extra looks that are not included in the global one. You can find their details below:
Extra Looks
Alert Distribution per Day of Week:
Number of alerts received in each day of the week, stacked by the time interval that the alert was received, i.e, the number of alerts received during business hours and off-hours distributed per day of week. Business hours time interval definition can be changed from the filters. Please use the ‘is between’ operator for the filter. For configuring the time intervals, please write the hours as numbers (An example can be seen from the default value.). If you would like to give minutes, you can use dots in between, for example 9.30 to 18.30.
Alerts Created vs Closed:
Number of alerts created vs number of alerts closed. Please note that this look would only include the alerts that are created after the beginning date of the time interval.
2- Team Productivity Analytics

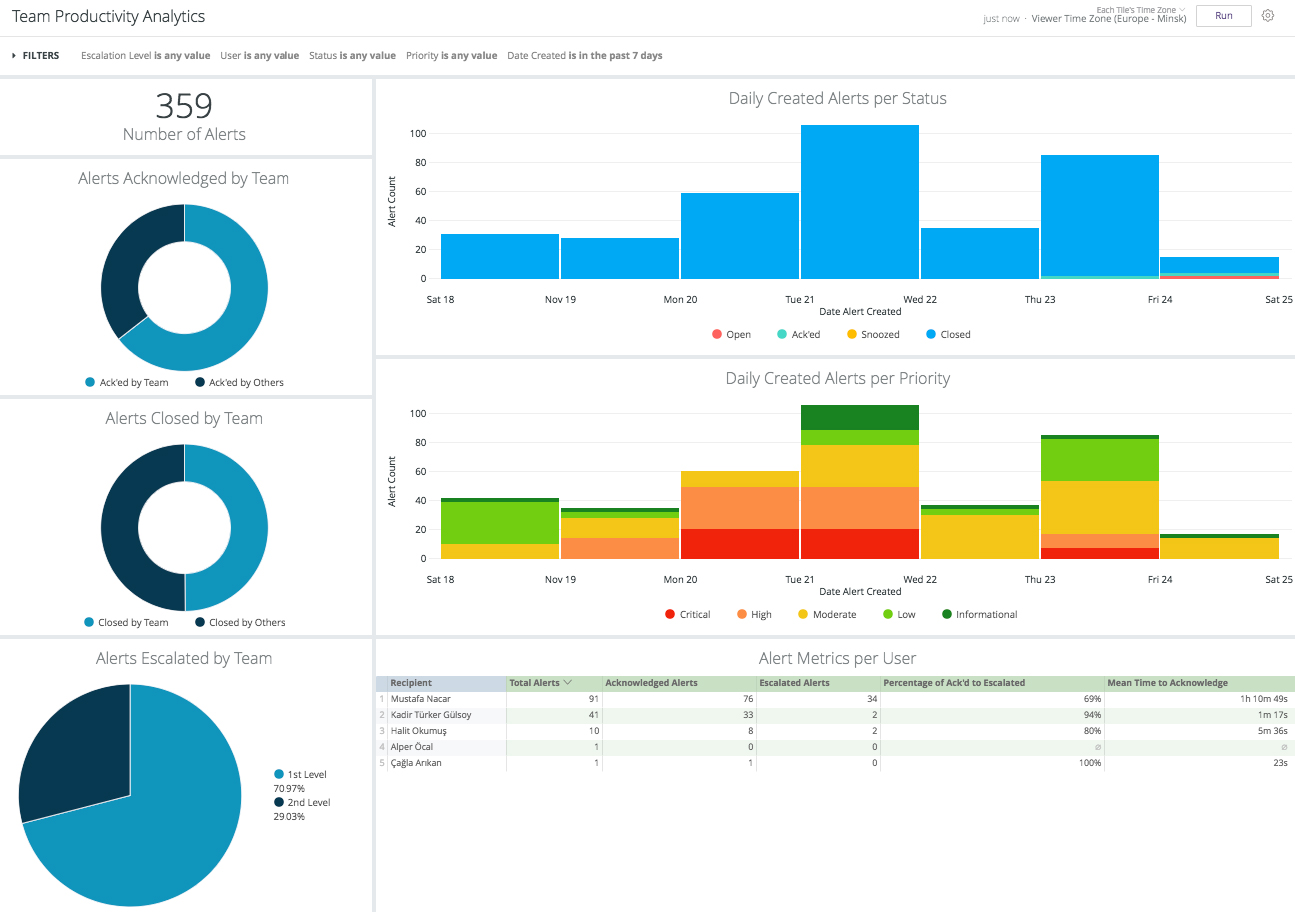
This dashboard is an in-depth look at the particular team selected on the side menu and the alerts they received over a designated period of time selected as a filter.
Filters: Escalation Level, User, Status, Priority, Date Created
Looks
Number of Alerts:
Total number of alerts that the team received.
Alerts Acknowledged by Team:
Number of alerts that are acknowledged by the team vs. acknowledged by others, for the alerts that the team had received.
Alerts Closed by Team:
Number of alerts that are closed by the team vs. closed by others, for the alerts that the team received.
Alerts Escalated by Team:
Number of alerts that are escalated to the next levels of the escalations, for the alerts that the team received.
Daily Created Alerts per Status:
Daily distribution of alerts grouped by status.
Daily Created Alerts per Priority:
Daily distribution of alerts grouped by priority.
Alert Metrics per User:
Table showing alert related attributes for the users that are the recipients of the alerts that the team received. It includes total alerts that the user received, how many of them were acknowledged by the user, how many of them got escalated, the percentage of ack’ed to escalated, and the user’s MTTA.
3- User Productivity Analytics

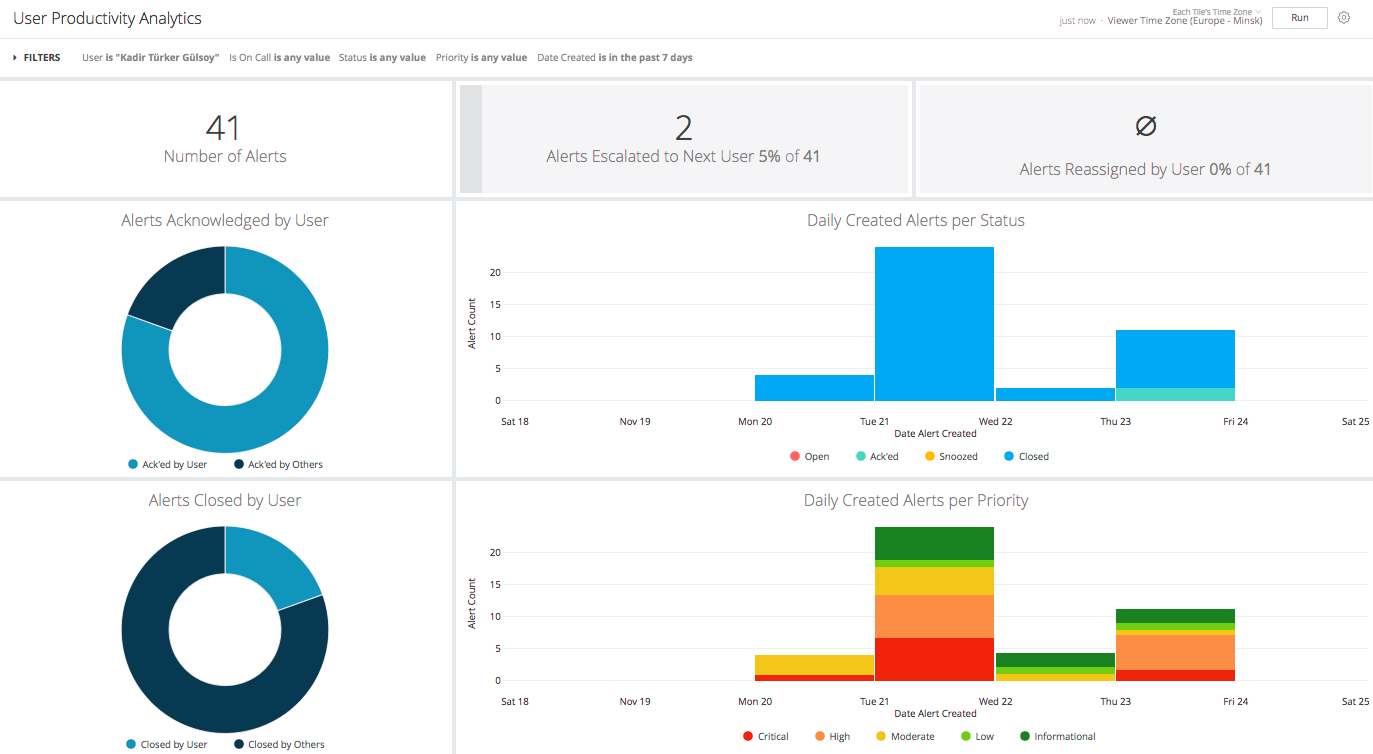
This dashboard is an in-depth look at a particular user and the alerts they received over a designated period of time selected as a filter. It is automatically filtered by the team selected on the side menu, so this dashboard would show the analysis based on the alerts that the user had received in a particular team.
It is important to note that a user must be selected in the filters as a first action when you access this dashboard, or else data will not be displayed.
Filters: Time Period
For further details about the looks that this dashboard contains, please refer here.
Updated 10 months ago
