Alert MTTA/R Reports
This team-based report contains the 'Alert MTTA/R Analytics' dashboard.
Alert MTTA/R Analytics

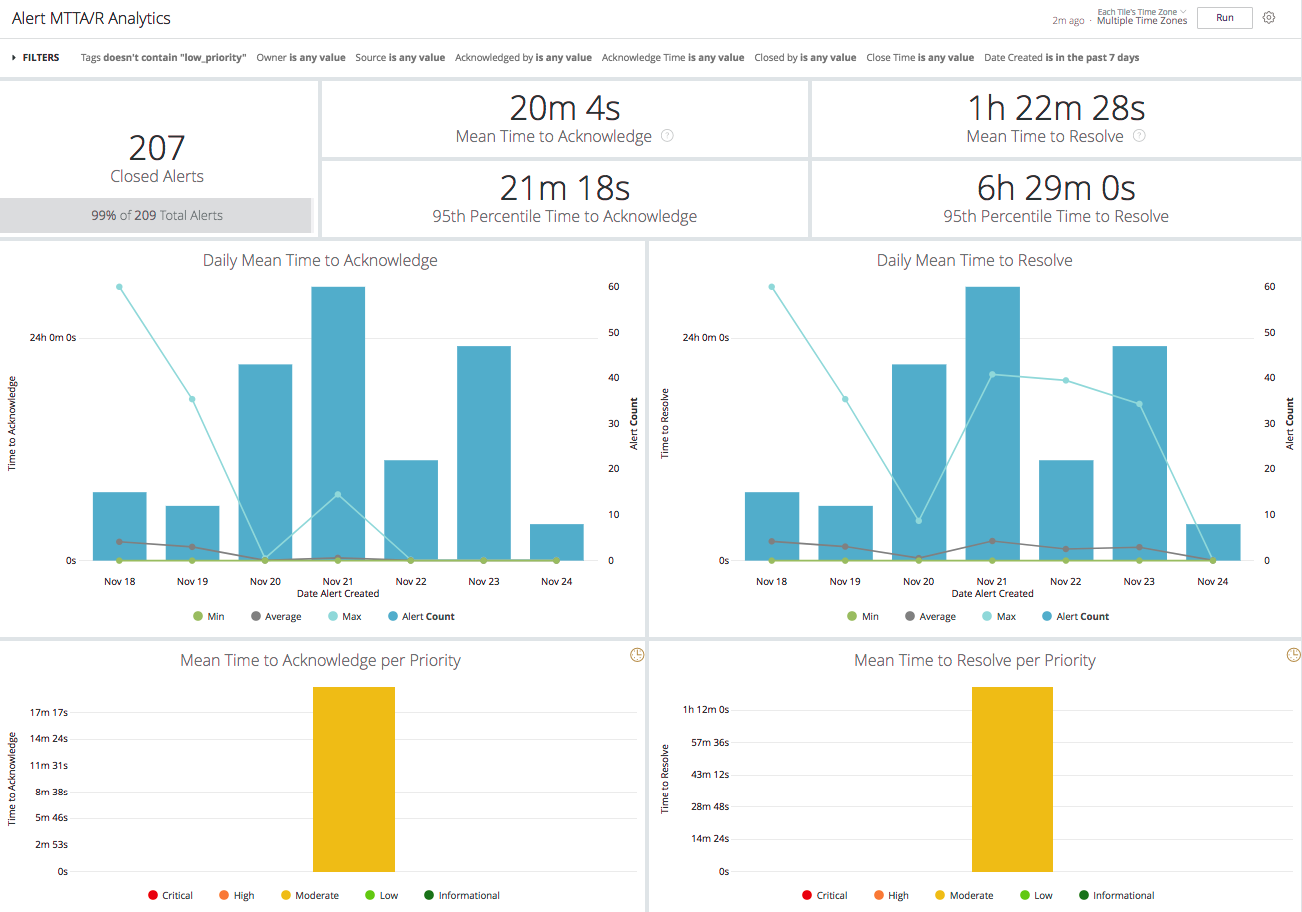
This dashboard includes the MTTA/R metrics and graphs for the alerts created over a designated period of time, automatically filtered by the team selected on the side menu. Please note that this dashboard is taking the closed alerts into consideration while calculating the metrics, to have a common set of alerts overall all the looks. Please refer to this document for the details of the common looks that this dashboard has with the Global MTTA/R Analytics dashboard.
Filters: Tags, Owner, Source, Acknowledged by, Acknowledge Time, Closed by, Close Time, Date Created
This team-based report has extra looks that are not included in the global one. You can find their details below:
Extra Looks
95th Percentile Time to Acknowledge:
95th percentile of the acknowledge time of the alerts, i.e, 95 percent of the alerts that are matching to filters of the dashboard have their acknowledge time under the value specified in this metric.
95th Percentile Time to Resolve:
95th percentile of the resolve time of the alerts, i.e, 95 percent of the alerts that are matching to filters of the dashboard have their close time under the value specified in this metric.
MTTA per Priority:
Mean time to acknowledge the alerts based on their priority. Alerts with no priority are marked as ‘Unknown’.
MTTR per Priority:
Mean time to resolve the alerts based on their priority. Alerts with no priority are marked as ‘Unknown’.
Updated 10 months ago
